Unlock a world of possibilities! Login now and discover the exclusive benefits awaiting you.

Announcements
Share your agentic AI experience, learn from others, and earn a new badge: Put Agentic AI to Work
- Qlik Community
- :
- All Forums
- :
- QlikView
- :
- urgent: dynamic age range
Options
- Subscribe to RSS Feed
- Mark Topic as New
- Mark Topic as Read
- Float this Topic for Current User
- Bookmark
- Subscribe
- Mute
- Printer Friendly Page
Turn on suggestions
Auto-suggest helps you quickly narrow down your search results by suggesting possible matches as you type.
Showing results for

 shahamel
Creator
2013-01-03
07:37 AM
- Mark as New
- Bookmark
- Subscribe
- Mute
- Subscribe to RSS Feed
- Permalink
- Report Inappropriate Content
urgent: dynamic age range
Dear QV-users,
I want to combine two dimensions.
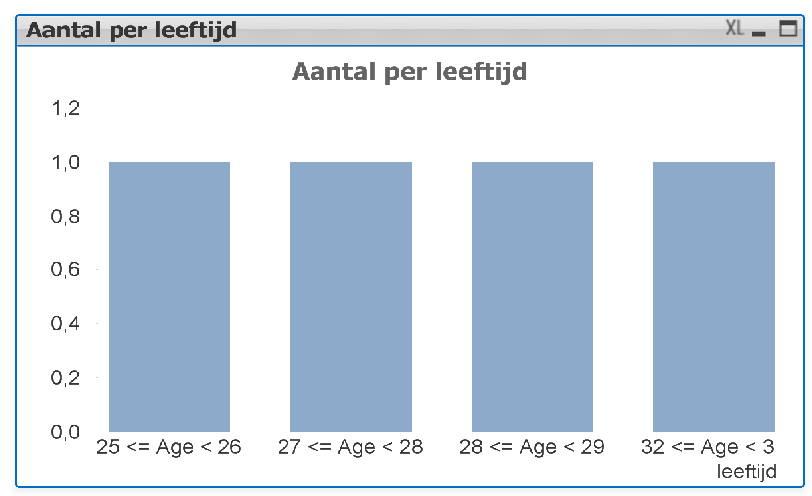
This graph (number per age) has a calculated dimension:
= class(floor((Today()-Geboortedatum)/365.25),$(AgeRange),'Age')
Geboortedatum = Date of birth
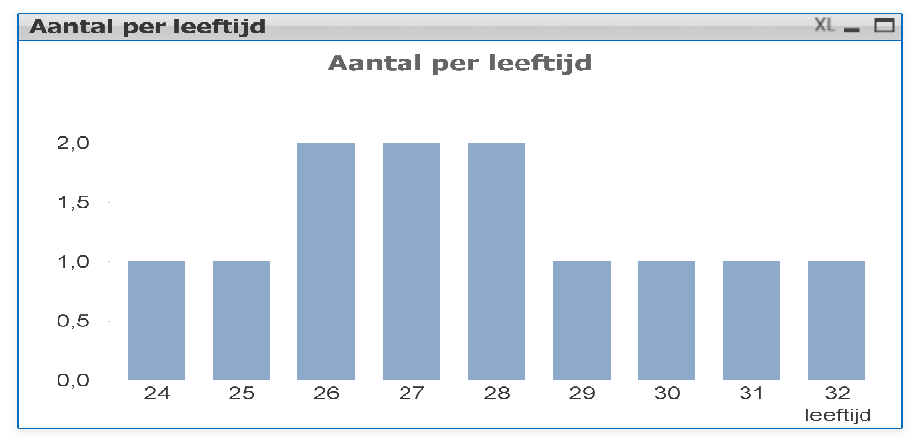
This graph has a calculated dimension:
=Jaar-Geboortejaar
Jaar = Year
Geboortejaar = Year of birth
I would like to combine those two calculated dimensions into ONE dimension within ONE graph
1,429 Views
1 Solution
Accepted Solutions
shahamel
Creator
2013-01-03
07:48 AM
Author
- Mark as New
- Bookmark
- Subscribe
- Mute
- Subscribe to RSS Feed
- Permalink
- Report Inappropriate Content
977 Views
1 Reply
shahamel
Creator
2013-01-03
07:48 AM
Author
- Mark as New
- Bookmark
- Subscribe
- Mute
- Subscribe to RSS Feed
- Permalink
- Report Inappropriate Content
=
class(floor(
(Jaar-Geboortejaar)),
$(AgeRange)
,'Age')
978 Views
