Unlock a world of possibilities! Login now and discover the exclusive benefits awaiting you.
Product Innovation
By reading the Product Innovation blog, you will learn about what's new across all of the products in our growing Qlik product portfolio.
Support Updates
The Support Updates blog delivers important and useful Qlik Support information about end-of-product support, new service releases, and general support topics.
Qlik Academic Program
This blog was created for professors and students using Qlik within academia.
Community News
Hear it from your Community Managers! The Community News blog provides updates about the Qlik Community Platform and other news and important announcements.
Qlik Digest
The Qlik Digest is your essential monthly low-down of the need-to-know product updates, events, and resources from Qlik.
Qlik Learning
The Qlik Learning blog offers information about the latest updates to our courses and programs, as well as insights from the Qlik Learning team.
Recent Blog Posts
-
Conditional Background Images
In this blog post, I will illustrate two ways that an image in an analytics app can be changed dynamically based on selections. In one example, a layout container and the show condition is used to control which image is visible. In a second example, an IF statement is used to determine which image URL to use. In the second example, I will also review how to obtain the URL for an image in the media library of an analytics app. Let’s begin by looki... Show MoreIn this blog post, I will illustrate two ways that an image in an analytics app can be changed dynamically based on selections. In one example, a layout container and the show condition is used to control which image is visible. In a second example, an IF statement is used to determine which image URL to use. In the second example, I will also review how to obtain the URL for an image in the media library of an analytics app.
Let’s begin by looking at the first example. In this example, we have an app on automobiles. When the user selects one of the automobile names, a picture of the car will be visible. If no cars are selected, then an image of all 4 automobiles should be displayed. Below is the image with no selections and all 4 cars visible.
When the Nebula model is selected, the sheet updates and only the Nebula model is visible.
In this example, a layout container has 5 Text & image objects – one image for each automobile model and one image for all cars.
A show condition like this is used to determine if the Text & image object should be visible. Only one image will be visible at any given time.
Now, let’s look at another example of how the background image can be dynamically displayed using an URL. In this example, one Text & image object is needed. In the properties of the object, under Presentation > Styling, a background image can be set. When URL is selected from the drop-down list, the option to enter an expression is available. Note that you want to edit the Background image setting that is in Presentation > Styling, not the Background image section in the properties panel.
The IF statement below checks to see which automobile model is selected to determine which image to show. If there is not a selection on the model, then the image of all the automobiles is displayed. In this example, the URLs for the media library images were used, but you could also link to images in an external source like an Amazon s3 bucket.To find the URL for images in the media library, you can open the media library or use a sheet in the app that has the image on it. In my Chrome browser, I opened the Developer tools to inspect the image. In Chrome, the Developer tools can be opened by using Ctrl-Shift-I or from the three-dots icon in the upper right corner of the browser window and selecting More tools > Developer tools. Once the Developer tools window is open you can inspect an element by clicking on the Elements tab and then selecting the image in the highlighted box below. This will allow you to select elements on the page.
In the analytics app, click on the image in the library so that it appears in the preview window. When you click on the image in the preview window, you will see that a line in the html is highlighted. If necessary, expand the code to find the URL for the image.
Copy the URL that is listed in the src attribute for the img tag (see below). In the expression, you can use the full URL that includes https:// and the tenant name or just what is displayed in the src tag. Repeat these steps for each image.
I found this insight useful, and I hope you do, too. I would like to thank my colleagues @Charles_Bannon for the blog idea and use of his app to provide examples and @Ouadie for the tip on how to capture the media library URL.
Thanks,
Jennell
-
Qlik Alerting: Removal of Force HTTP only capability
Edited: 5th of December 2025, added 'What action do I need to take' Hello Qlik Alerting Admins, With the release of Qlik Alerting November 2025, the capability to Force HTTP only will be fully removed. Why is Force HTTP being removed? The change is motivated by two key reasons: It aligns Qlik Alerting with modern web security practices The configuration, while previously documented, was not functional for some time due to the upgrade-insecur... Show MoreEdited: 5th of December 2025, added 'What action do I need to take'
Hello Qlik Alerting Admins,
With the release of Qlik Alerting November 2025, the capability to Force HTTP only will be fully removed.
Why is Force HTTP being removed?
The change is motivated by two key reasons:
- It aligns Qlik Alerting with modern web security practices
- The configuration, while previously documented, was not functional for some time due to the upgrade-insecure-requests Content Security Policy
What action do I need to take?
With the deprecation of HTTP config, administrators need to take additional action upon installing the new release. See Qlik Alerting - Qlik Sense extension | help.qlik.com for details, specifically step 5:
-
For Session cookie isolation, select Cookie sharing. This setting allows cookie sharing with Qlik Alerting, which is required for user validation.
If you have any questions, we're happy to assist. Contact us using chat or reply in this thread.
Thank you for choosing Qlik,
Qlik Support -
【オンデマンド配信】自治体向け海外事例に学ぶ自治体が保有する情報の効果的な公開
自治体が保有するデータを活用し、住民サービスの向上や市政の透明性を高める取り組みが国内で加速しています。オープンデータの公開は、行政の信頼性向上や市民参加の促進、さらには地域課題の解決にもつながる重要な手段です。本 Web セミナーでは、海外の先進事例を交えながら、自治体がどのようにデータを公開し、民間や市民と連携して新たな価値を創出しているかを具体的にご紹介します。 ※ パソコン・タブレット・スマートフォンで、どこからでもご視聴いただけます。今すぐ視聴する 今すぐ視聴する -
Super Vendas
Super Vendashorus CDAMeu primeiro app Qlik.DiscoveriesAprendi a usar uma extensão de gráfico em mapa e a mudar dinamicamente uma série histórica.ImpactConsegui desenvolver bastante novas habilidades para o meu primeiro appAudienceDesafio da própria empresaData and advanced analyticsHabilidades de ETL e dashboard desenvolvidas nesse desafio -
HR Analysis
HR Analysis HORUS CDA The purpose of this app was to learn more about design and visual design with a generated DB in qlik. Discoveries The amazing amount of design possibilities with qlik sense. Impact The app has impacted my learning very much, now im able to help my company by creating better apps. Audience It was only used by me, i'm an intern. Data and advanced analytics Has helped the company by helping me learn... Show MoreHR AnalysisHORUS CDA The purpose of this app was to learn more about design and visual design with a generated DB in qlik.
Discoveries
The amazing amount of design possibilities with qlik sense.
Impact
The app has impacted my learning very much, now im able to help my company by creating better apps.
Audience
It was only used by me, i'm an intern.
Data and advanced analytics
Has helped the company by helping me learn
-
We are spending trillions on AI data centers, but are we teaching people to unde...
Artificial intelligence is changing our world at lightning speed. Everywhere we look, new tools and technologies are being built to make things smarter and faster. A recent New York Times article, What Wall Street Sees in the Data Center Boom, shows just how massive this transformation is. Trillions of dollars are being invested in data centers, the “brains” that power AI. But the article also reminds us that all this progress comes with a cost: ... Show MoreArtificial intelligence is changing our world at lightning speed. Everywhere we look, new tools and technologies are being built to make things smarter and faster.
A recent New York Times article, What Wall Street Sees in the Data Center Boom, shows just how massive this transformation is. Trillions of dollars are being invested in data centers, the “brains” that power AI. But the article also reminds us that all this progress comes with a cost: higher energy and water use, pressure on local communities, and even the risk of a financial bubble if this growth is not sustainable.
Reading it made me stop and think: Are we investing as much in understanding data as we are in building it?
Here at Qlik, we believe technology alone doesn’t make the world better, people do. And people can only make good decisions with data if they know how to read it, question it, and use it responsibly.
That’s what the Qlik Academic Program is all about. We want every student and educator, no matter where they are or what they teach, to have the chance to learn how to use data to solve real problems.
Imagine if every student learning about AI today also asked:
-
How can we make technology that helps the planet, not harms it?
-
Are we designing systems that serve everyone or just a few?
-
What does it mean to use data responsibly in a world driven by algorithms?
Those questions are where true innovation begins.
As the article points out, many companies are now rethinking how technology can drive progress that truly benefits everyone. That’s the same vision behind our Academic Program: to democratize knowledge, bridge the data gap, and empower people everywhere to use analytics for social good.
The AI revolution will be defined not only by algorithms and data centers, but by how wisely we use the data we already have.
Let’s make sure we are building not just the infrastructure for machines, but the understanding for humankind.
The Qlik Academic Program helps make this possible, giving educators, students, researchers, and universities everywhere free access to Qlik Sense, online training, and certifications to use data ethically and effectively.
💡 Join our global community for free: Qlik Academic Program: Creating a Data-Literate World
-
-
Want to know how data literate you are?
Take this free assessment: The Data Literacy Project
-
Qlik Introduces AI Improved Search with Semantic Search
In an upcoming update, searching within Qlik will be improved with Semantic Search. -
Qlik Talend Cloud and Qlik Stitch: Upcoming new NetSuite REST Connector
Hello Qlik Talend Cloud and Qlik Stitch admins, Oracle has announced that starting with the NetSuite 2026.1 release, SOAP web services will no longer be supported. You can read the official announcement in SOAP Web Services endpoint release and support policy changes (community.oracle.com). To ensure a smooth transition and prevent any disruption to your data workflows, Qlik is actively developing a new NetSuite connector that leverages the RES... Show MoreHello Qlik Talend Cloud and Qlik Stitch admins,
Oracle has announced that starting with the NetSuite 2026.1 release, SOAP web services will no longer be supported. You can read the official announcement in SOAP Web Services endpoint release and support policy changes (community.oracle.com).
To ensure a smooth transition and prevent any disruption to your data workflows, Qlik is actively developing a new NetSuite connector that leverages the REST API for Qlik Talend Cloud and Qlik Stitch.
As we move closer to the release, Qlik will keep you informed of:
- The targeted launch date of the new REST connector
- A recommended migration plan to help you prepare
- Details on the deprecation timeline for our existing SOAP-based connector
We’re committed to making this transition seamless and will provide all necessary guidance to support your migration.
Thank you for choosing Qlik,
Qlik Support -
Automating Management Summaries from Any Qlik Dashboard
Automating Management Summaries from Any Qlik DashboardGINQO This showcase demonstrates how to generate a management summary from any Qlik dashboard using Qlik Cloud Analytics, Qlik Application Automation, and Qlik Reporting Services. The workflow extracts chart data, processes it using any chosen AI model, and generates a report by combining the data, visuals, and commentary into a newsletter.DiscoveriesThis automation uncovers a new way to leve... Show MoreAutomating Management Summaries from Any Qlik DashboardGINQOThis showcase demonstrates how to generate a management summary from any Qlik dashboard using Qlik Cloud Analytics, Qlik Application Automation, and Qlik Reporting Services. The workflow extracts chart data, processes it using any chosen AI model, and generates a report by combining the data, visuals, and commentary into a newsletter.Discoveries
This automation uncovers a new way to leverage Qlik dashboards, not just for interactive analysis, but as a data storytelling engine. Key discoveries include: The ability to transform any visualization into a management-ready summary using Qlik Application Automation. Streamlining insight delivery by connecting analytics directly to narrative reporting. Demonstrating how Qlik’s automation and reporting layers can replace manual interpretation and formatting.
Impact
This solution has both operational and strategic impact. It eliminates manual report generation, saving hours of analyst time per cycle, and leaders receive real-time summaries derived from dashboards. Bottom line: Faster insights, less effort, and higher business alignment.
Audience
Business Leaders & Executives Data & BI Developers Analytics Managers / PMs
Data and advanced analytics
While this project focuses on automation and reporting, it lays the foundation for AI-assisted analytics.
-
How OData APIs Ensures Your Trusted Data Products are Consumable Everywhere
We’ve always known that the true value of data doesn’t come from the raw data artifacts, but rather from the refined, trusted Data Products that organizations use to make decisions. Unfortunately, many of these governed data assets remain locked behind proprietary APIs or custom connectors, making data consumption a frustrating scavenger hunt. We’ve done our best at Qlik to make access easy within our own ecosystem, but what if you need data prod... Show MoreWe’ve always known that the true value of data doesn’t come from the raw data artifacts, but rather from the refined, trusted Data Products that organizations use to make decisions. Unfortunately, many of these governed data assets remain locked behind proprietary APIs or custom connectors, making data consumption a frustrating scavenger hunt. We’ve done our best at Qlik to make access easy within our own ecosystem, but what if you need data products to flow securely and seamlessly to other BI solutions, productivity applications, and, increasingly important, every autonomous AI agent across your organization? We have the answer!
-
Knowledge Nuggets 2025Q3
Knowledge Nuggets 2025Q3Insight ConsultingThe app showcases and organizes recent community contributions, serving as an additional learning resource.DiscoveriesTop contributors and topicsImpactServes as a additional learning resourceAudienceQlik Developers and other stakeholdersData and advanced analyticsServes as a additional learning resource -
Get to Know our Expert Instructors!
Join us now as we travel to the birthplace of American independence and home to the signing of the Declaration of Independence and the Constitution. That’s right, we’re talking about Philadelphia! Beyond its pivotal role in the nation's founding, it's also a vibrant metropolis with a rich cultural heritage, incredible landmarks and the country’s first ever zoo. Did you know that Philadelphia is famous for its vibrant street art, boasting over 4,0... Show MoreJoin us now as we travel to the birthplace of American independence and home to the signing of the Declaration of Independence and the Constitution. That’s right, we’re talking about Philadelphia! Beyond its pivotal role in the nation's founding, it's also a vibrant metropolis with a rich cultural heritage, incredible landmarks and the country’s first ever zoo. Did you know that Philadelphia is famous for its vibrant street art, boasting over 4,000 murals throughout the city, earning it the title of the "Mural Capital of the World"?
-
Connector Factory - July, August & September 2025 releases
For July, August & September 2025, Connector Factory has released more connectors and enhancements for data integration, data analytics and application automation. -
Qlik Sense and Vulnerability “CVE-2025-7783” in NPM Library form-data
Hello Qlik Users, In mid-July 2025, a vulnerability was disclosed in the NPM library form-data (GitHub Security Advisory). Qlik became aware of this issue through its standard Secure Development Lifecycle (SDL) processes. Following an internal review, Qlik R&D and Security teams identified that potentially vulnerable versions of the form-data library were included in some installations of Qlik Sense Enterprise for Windows. However, due to the spe... Show MoreHello Qlik Users,
In mid-July 2025, a vulnerability was disclosed in the NPM library form-data (GitHub Security Advisory). Qlik became aware of this issue through its standard Secure Development Lifecycle (SDL) processes.
Following an internal review, Qlik R&D and Security teams identified that potentially vulnerable versions of the form-data library were included in some installations of Qlik Sense Enterprise for Windows. However, due to the specific way Qlik utilizes this library, the conditions required for exploitation are not met.
Although the vulnerability was determined to be non-exploitable within Qlik Sense, customers who prefer to upgrade to a version that includes the patched form-data library can do so by installing one of the following releases:
- May 2025 Patch 6
- November 2024 Patch 18
- May 2024 Patch 24
Note: An earlier version of this information was mistakenly published indicating that this CVE was directly related to Qlik Sense for Windows.
Thank you for choosing Qlik,
Qlik Global Support -
Qlik Sense Qualification Exams - 2024 Update
Qlik Education is pleased to announce the Business Analyst and Data Architect Qualification Exams have been updated!
-
XJTL University's innovative use of Qlik Academic Program
At the XJTL University in China, participants worked on a business scenario to prepare for a business case to develop and challenge their assumptions at different stages. Qlik Sense was used as the primary authoring tool leveraging the Qlik Academic Program, made available to all students at XJTL University. -
Watch Q&A with Qlik: Qlik Cloud Analytics Administration!
Don't miss our previous Q&A with Qlik! Pull up a chair and chat with our panel of experts to help you get the most out of your Qlik experience. SEE THE RECORDING HERE
-
BBC Best Paid Presenters 2025
BBC Best Paid Presenters https://www.bbc.co.uk/news/articles/c15wxgjn9xjo R M Using layout container to reproduce BBC Chart Discoveries How to use layout container, tree map and buttons to build a Dashboard Impact As a concept it can be used to show Sales Audience Everyone Data and advanced analytics New way of showing data -
Straight Table
The straight table, included in the Visualization bundle, has all the table properties that we are used to as well as many new features. These new features make it easier for developers to create a straight table and it gives users the ability to customize straight tables in the apps they view. The straight table is ideal when you want to provide detailed data – the raw data. While you do not want to have too many columns (ten or less columns are... Show MoreThe straight table, included in the Visualization bundle, has all the table properties that we are used to as well as many new features. These new features make it easier for developers to create a straight table and it gives users the ability to customize straight tables in the apps they view. The straight table is ideal when you want to provide detailed data – the raw data. While you do not want to have too many columns (ten or less columns are ideal for the best performance), a straight table can have many columns (dimensions and measures).
As previously mentioned, the straight table can be added to a sheet from the Qlik Visualization bundle. This means developers will need to open the advanced options to add the straight table to their sheet(s) and make edits. Once the straight table is added to a sheet, developers can add columns – either fields and master items or custom expressions. One of the new features that developers can take advantage of to build tables quickly is the ability to add more than one dimension and/or measure at once. Simply select the dimensions and measures you would like to add to the table and then click the Add button.
Once columns are added to the table, they can be dragged as needed to the desired position/order. Developers also can add alternate columns to the straight table. These columns can be dimensions and/or measures. These alternates columns will be available to users to customize the straight table if chart exploration is enabled. This is a great new feature because the user does not need edit permissions to modify the straight table. Users can add and/or remove columns based on their analysis. Being able to add columns as needed also improves performance since the straight table does not need to display all the columns, all the time. Loading the straight table with the minimum columns needed will decrease the load time.
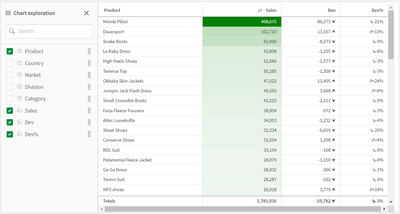
Chart exploration allows users, who are in analysis mode, to add and remove columns from the straight table they are viewing by checking or unchecking them in the Chart exploration panel (see image below). Any users viewing the sheet can customize the straight table. Users cannot see layout changes made by other users using the app, unless they opt to share the visualization or create a public bookmark with the layout saved.
Another new feature for developers is the ability to set the column width. By default, the column width is set to Auto, but developers can set it to Fix to content, Pixels or Percentage. Pagination is another new feature that can be enabled in a Straight table. With pagination, a specified number of rows are displayed at once and the user can navigate through the pages using arrows or selecting the page.
Many of the properties for the straight table are familiar but the new ones are moving the straight table to a new level. Learn everything you need to know about the straight table in Qlik Help and add one to your next app. Also check out the SaaS in 60 video for a quick video overview:
Thanks,
Jennell