Unlock a world of possibilities! Login now and discover the exclusive benefits awaiting you.
Product Innovation
By reading the Product Innovation blog, you will learn about what's new across all of the products in our growing Qlik product portfolio.
Support Updates
The Support Updates blog delivers important and useful Qlik Support information about end-of-product support, new service releases, and general support topics.
Qlik Academic Program
This blog was created for professors and students using Qlik within academia.
Community News
Hear it from your Community Managers! The Community News blog provides updates about the Qlik Community Platform and other news and important announcements.
Qlik Digest
The Qlik Digest is your essential monthly low-down of the need-to-know product updates, events, and resources from Qlik.
Qlik Learning
The Qlik Learning blog offers information about the latest updates to our courses and programs, as well as insights from the Qlik Learning team.
Recent Blog Posts
-
Reflecting on 2024 and Preparing for an Exciting New Semester with Qlik’s Academ...
See how you can make the New Year great with Qlik! -
Simplifying GenAI Data Pipelines with Qlik Talend Cloud
Watch a DEMO of this capability HERE! Generative Artificial Intelligence (GenAI) and related applications have exploded into the tech scene over the last couple of years. While the technology shows great promise, building data pipelines that leverage customers structured and unstructured data is a challenging and high effort integration activity. Qlik Talend Cloud (QTC) Knowledge Mart data capabilities enable customers to simplify and accelerate... Show MoreWatch a DEMO of this capability HERE!
Generative Artificial Intelligence (GenAI) and related applications have exploded into the tech scene over the last couple of years. While the technology shows great promise, building data pipelines that leverage customers structured and unstructured data is a challenging and high effort integration activity.
Qlik Talend Cloud (QTC) Knowledge Mart data capabilities enable customers to simplify and accelerate the work needed to have their data flowing to Large Language Model (LLM) Retrieval Augmented Generation (RAG) based GenAI applications. In this blog we’ll cover this exciting new capability to simplify using your data with GenAI applications.
-
Updates to Qlik Cloud Security Roles
On April 16th, 2024, Qlik is launching a highly anticipated capability: custom security roles. What do custom security roles do? Custom security roles introduce fine control of data export and access permissions within Qlik apps. This allows you to tailor permissions to your specific needs, enhancing data security and compliance. The first delivery on April 16th includes the capability to control who can export content. Additional capabilities wi... Show MoreOn April 16th, 2024, Qlik is launching a highly anticipated capability: custom security roles.
What do custom security roles do?
Custom security roles introduce fine control of data export and access permissions within Qlik apps. This allows you to tailor permissions to your specific needs, enhancing data security and compliance.
The first delivery on April 16th includes the capability to control who can export content. Additional capabilities will be added soon after, such as who can create data connections, reports, and similar.
What does this mean for me?
As part of this update, the existing "has restricted view" space role will gain the ability to export data to Excel. This adjustment is in line with Qlik's capacity-based pricing model, ensuring basic users have essential tools.
If you do not wish for users with the "has restricted view" space role to be able to export data, you will need to edit the User Default role to deny download for all users, and then create a custom role that allows if for specific users and groups.
Stay tuned for more information and resources leading up to the April 16th launch. We are excited about these enhancements and the value they will bring to your data management and security efforts within Qlik.
Thank you for choosing Qlik,
Qlik Support -

-
【オンデマンド配信】アフター AI :混乱の渦中でデータ・インサイト・アクションを変革
AI は現実に。その先は? 2024年が生成 AI の急速な普及が落ち着いた年だったとすれば、2025年は多くの企業がアフター AI の世界で自社の方向性を模索する年になると予測されます。AI は、社会とビジネスに根本的な変革をもたらしています。その一方で、これまで以上に不明確性が増し、AI の進化だけでなく、企業の成長にとっても脅威となっています。 「アフター AI :混乱の渦中でデータ・インサイト・アクションを変革」では、データの世界の AI に関する 3 つのトピックと関連するトレンドを深掘りします。混乱の渦中でも AI を活用して優れた成果を創出し、ビジネス価値を最大化するためのトレンドを考察します。 ※ 参加費無料。パソコン・タブレット・スマートフォンで、どこからでもご視聴いただけます。日本語字幕付きでお届けします。 今すぐ視聴する「企業は、AI 活用の岐路に立っています。持続可能で経済的かつ安全な方法で AI を活用し、価値を引き出す必要があります。」 - Qlik トレン... Show MoreAI は現実に。その先は?
2024年が生成 AI の急速な普及が落ち着いた年だったとすれば、2025年は多くの企業がアフター AI の世界で自社の方向性を模索する年になると予測されます。AI は、社会とビジネスに根本的な変革をもたらしています。その一方で、これまで以上に不明確性が増し、AI の進化だけでなく、企業の成長にとっても脅威となっています。
「アフター AI :混乱の渦中でデータ・インサイト・アクションを変革」では、データの世界の AI に関する 3 つのトピックと関連するトレンドを深掘りします。混乱の渦中でも AI を活用して優れた成果を創出し、ビジネス価値を最大化するためのトレンドを考察します。
※ 参加費無料。パソコン・タブレット・スマートフォンで、どこからでもご視聴いただけます。日本語字幕付きでお届けします。
今すぐ視聴する
「企業は、AI 活用の岐路に立っています。持続可能で経済的かつ安全な方法で AI を活用し、価値を引き出す必要があります。」 - Qlik トレンド Web セミナー講演者:Qlik マーケットインテリジェンスリード Dan Sommer -
Navigating Qlik Cloud's newest user experience. Better findability, smoother nav...
Everything you need to know about the new user experience across Qlik Cloud Analytics and Qlik Talend Cloud. Welcome to a new world where you always know where to go. -
DC Messenger
DC Messenger Differentia Consulting DC Messenger was built to simplify access to Qlik data by integrating it with WhatsApp, making data-driven insights accessible from anywhere. It allows users to ask questions about their Qlik estate, receiving tailored visualizations, answers from Qlik Answers assistants, key statistics, and performing actions like app reloads directly within the messaging app. Differentia Consulting designed DC Mess... Show MoreDC MessengerDifferentia Consulting DC Messenger was built to simplify access to Qlik data by integrating it with WhatsApp, making data-driven insights accessible from anywhere. It allows users to ask questions about their Qlik estate, receiving tailored visualizations, answers from Qlik Answers assistants, key statistics, and performing actions like app reloads directly within the messaging app.Differentia Consulting designed DC Messenger for business users and analysts, the app bridges the gap between technical tools and everyday accessibility. DC Messenger has streamlined decision-making by providing quick, actionable insights, enhancing productivity and responsiveness.

Discoveries
Some of the discoveries from using this app include:
• Improved accessibility to Qlik insights
• Simplified interaction with data through WhatsApp over traditional BI tools
• Real-time app reloads via messaging enable teams to react quickly to changes in data, boosting operational efficiency
Impact
DC Messenger has made it easier for our team to access Qlik data and perform actions without needing to log into the platform. This has saved time and allowed users to quickly get the answers or updates they need, even when they're away from their desks.
Audience
Can send messages to up to 100,000 unique numbers in a 24-hour period.
Data and advanced analytics
• Various structured datasets contained in the Qlik estate
• Roughly 100 files of unstructured data accessible via Qlik Answers
• Five different LLMs are accessible for users to query and use for analysis
-
Techspert Talks - Qlik Cloud App Navigation Showcase
Hi everyone, Want to stay a step ahead of important Qlik support issues? Then sign up for our monthly webinar series where you can get first-hand insights from Qlik experts. The Techspert Talks session from December was a Qlik Cloud App Navigation Showcase. But wait, what is it exactly?Techspert Talks is a free webinar held on a monthly basis, where you can hear directly from Qlik Techsperts on topics that are relevant to Customers and Partners... Show MoreHi everyone,
Want to stay a step ahead of important Qlik support issues? Then sign up for our monthly webinar series where you can get first-hand insights from Qlik experts.
The Techspert Talks session from December was a Qlik Cloud App Navigation Showcase.
But wait, what is it exactly?
Techspert Talks is a free webinar held on a monthly basis, where you can hear directly from Qlik Techsperts on topics that are relevant to Customers and Partners today.In this session, we will cover:
- Exploring Cloud Analytics Navigation
- New developments for better flow
- Tricks for moving around quicker
Click on this link to watch the recording.

-
【新着レポート】Qlik、データ統合ツールで 9 年連続リーダーの 1 社に!
Gartner 社は、「2024年 Gartner® データ統合ツールの Magic Quadrant」を発表しました。Gartner 社が評価した 20 社のデータ統合メーカーの中で、Qlik は 9 年連続でリーダーの 1 社に評価されました。 分析や AI にビジネスに適した信頼できるデータを提供するには、適切なデータ統合ソリューションの選択が不可欠です。自社のビジネスニーズに最適なソリューションを選択するには?ぜひ、本レポートをご参考ください。 データ統合市場における Gartner 社 のインサイト Qlik がリーダーの 1 社に評価された理由 データ統合市場における各メーカーの評価 無料レポートを見る -
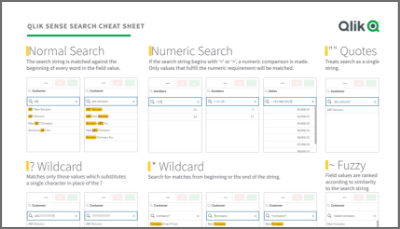
Qlik Sense Cheat Sheet version 2.0
It was back in 2015 when I first published the original Qlik Sense Search Cheat Sheet. Since then, and thanks to lots of individual contributors here in the Community, the Search Cheat Sheet has suffered several transformations to make it more complete and truthful.@afurtado wrote me an email a few weeks ago because he was interested in getting the document localized for the Brazilian folks out there. In addition to thank him for his contribution... Show MoreIt was back in 2015 when I first published the original Qlik Sense Search Cheat Sheet. Since then, and thanks to lots of individual contributors here in the Community, the Search Cheat Sheet has suffered several transformations to make it more complete and truthful.
@afurtado wrote me an email a few weeks ago because he was interested in getting the document localized for the Brazilian folks out there. In addition to thank him for his contribution and sending him the file I decided that it was about the time to get the Search Cheat Sheet an update.
Today I want to introduce a new version of the document. I added the compound search section to it (@jayanttibhe thanks for the tip), and I redesigned and rationalized the position of each element for better comprehension.
As an extra, I made the document multilanguage ready. So, if someone wants to translate the Cheat Sheet to other language (currently available in English, Spanish and Portuguese) please let me know in the comments section and I'll gladly tell you how to help us.
Hope you like it, and please share it.
Arturo
Updates:
Feb 28: French version thanks to @arychener
Feb 25: Italian added thanks to @AntonioCostantino . Russian translation updated
Feb 13, 2020: Cheat sheet includes now the ^ Wildcard to be consistent with Qlik Help. Russian language added thanks to the contribution of @martynova
Jan 29, 2020: German language added thanks to the contribution of @g_mitschke

-
New DevOps Features to Future-proof your Data Pipelines
In today’s data-driven world, managing real-time, trusted data pipelines is crucial for AI and business success. Qlik Talend Cloud’s new DevOps capabilities—like automated schema evolution, GitHub version control, and Import/Export APIs— simplify and optimize pipeline management. Learn more about these innovations and how these make it easier for developers and data engineers to build, collaborate, and scale data pipelines. Read on to discover ho... Show MoreIn today’s data-driven world, managing real-time, trusted data pipelines is crucial for AI and business success. Qlik Talend Cloud’s new DevOps capabilities—like automated schema evolution, GitHub version control, and Import/Export APIs— simplify and optimize pipeline management. Learn more about these innovations and how these make it easier for developers and data engineers to build, collaborate, and scale data pipelines. Read on to discover how these features can streamline your workflows and accelerate AI-driven decision-making.
Authors: Vijay Raja, Vincent Menard
-
Making it easier to share and find insights
At Qlik, we don’t just simplify data analysis—we empower you to curate and share it seamlessly with others. By sharing, you empower others to focus on insights instead of hurdles. When analytics is clear and accessible, everyone wins. -
Introducing explore.qlik.com
We’re excited to announce the launch of our enhanced Demo Site - explore.qlik.com, designed to showcase the full potential of Qlik’s product portfolio in an interactive and engaging way!
-
Upcoming change to variables in bookmarks and subscriptions in Qlik Cloud Analyt...
With a Qlik Cloud Analytics update on the 10th of December 2024, Qlik introduces a new feature which changes how variables are used in bookmarks. Developers now have a setting available for each variable to decide whether or not the variable should be included in bookmarks. The default is set to No, meaning variables are not included. Previously, a user had to check ”Save all variable states” on bookmark creation to include variables. This way ... Show MoreWith a Qlik Cloud Analytics update on the 10th of December 2024, Qlik introduces a new feature which changes how variables are used in bookmarks.
Developers now have a setting available for each variable to decide whether or not the variable should be included in bookmarks.
The default is set to No, meaning variables are not included.
Previously, a user had to check ”Save all variable states” on bookmark creation to include variables. This way of working is not recommended, since it is the app developer who knows which variables need to be saved.
For more information about the change and to join the active discussion, continue to App Development: Upcoming change to variables in bookmarks and subscriptions in Qlik Cloud Analytics.
Thank you for choosing Qlik,
Qlik Support -
Using the Qlik Talend Cloud to Find Answers
QTC data pipelines used to solve RAG AI use cases. -
Support from Educators Leads to Career Development
Students are speaking out about the crucial role educators play in their career development. Many believe that professors should be more involved in helping them navigate life after college. -
Embracing Diverse Learning Styles in Academia
Learning can be a challenge for many, while others may find it comes more easily. In our quest to discover the best approaches for individual learning, we recognize the importance of flexibility. By structuring our days to align with our natural rhythms and seeking inspiration when it strikes, we can absorb information more effectively—even if our methods differ from the norm. To explore strategies for thriving with ADHD in academia, check out... Show MoreLearning can be a challenge for many, while others may find it comes more easily. In our quest to discover the best approaches for individual learning, we recognize the importance of flexibility. By structuring our days to align with our natural rhythms and seeking inspiration when it strikes, we can absorb information more effectively—even if our methods differ from the norm.
To explore strategies for thriving with ADHD in academia, check out the full article here: Prevailing with ADHD in Academia.
At our Academic Program, we provide guidance and resources tailored for both students and educators. With various ways to learn Qlik at your own pace, you can gain valuable insights while developing your skills. Whether you need structured lessons or a more flexible approach, we’re here to support your learning journey!
To learn about how you can access free resources in data analytics if you are a student or professor, visit, www.qlik.com/academicprogram
-
Opportunity Dashboard
Reason Landing Page Win Vs Loss Opportunity Dashboard GainInsights Solutions This dashboard was one of my first attempts in QlikSense. It is a simple dashboard which gives insights over deals won and deals lost. It has competitor details and the reason why the deal was lost. It basically gives an idea about the strength of the organization and where it loses, to whom it loses and the reason for the loss. Reason Discoveries It is ... Show MoreReason
Landing Page
Win Vs Loss
Opportunity DashboardGainInsights SolutionsThis dashboard was one of my first attempts in QlikSense. It is a simple dashboard which gives insights over deals won and deals lost. It has competitor details and the reason why the deal was lost. It basically gives an idea about the strength of the organization and where it loses, to whom it loses and the reason for the loss.Discoveries
It is a dashboard which will give you a quick insight on deals won and deals lost.
Impact
This mainly helps the organization to see why they lost and to whom they lost and for a what reason. For example, 20% of their loss might be to one organization for one particular reason (the reason can be cost). So, the next time when they compete with an organization, they can strategize well to win deals.
Audience
Sales team of any organization
Data and advanced analytics
This mainly helps the organization to see why they lost and to whom they lost and for a what reason. For example, 20% of their loss might be to one organization for one particular reason (the reason can be cost). So, the next time when they compete with an organization, they can strategize well to win deals.
-
Qlik Data Transfer November 2022 expires on the 28th of November 2024
Updated November 14th 15:00 CET: Download link.Updated November 15th 15:40 CET: Release Notes. Hello Qlik Cloud Administrators, The current version of Qlik Data Transfer (November 2022) will expire on the 28th of November 2024. Your log files may already show the following information: ABOUT TO EXPIRE: This engine is about to expire. Please upgrade to a newer version! Expiry date: 2024/11/28 Qlik Data Transfer will stop functioning after this dat... Show MoreUpdated November 14th 15:00 CET: Download link.
Updated November 15th 15:40 CET: Release Notes.Hello Qlik Cloud Administrators,
The current version of Qlik Data Transfer (November 2022) will expire on the 28th of November 2024.
Your log files may already show the following information:
ABOUT TO EXPIRE: This engine is about to expire. Please upgrade to a newer version! Expiry date: 2024/11/28
Qlik Data Transfer will stop functioning after this date.
How do I prevent downtime?
A new version of Qlik Data Transfer has been released (14th of November), which will guarantee continued functionality and support until its end-of-support date. The November 2024 release is available on the Download page and its release notes can be accessed in Qlik DataTransfer Release Notes - November 2024.
Qlik Data Gateway - Direct Access
Whenever possible, Qlik recommends using Qlik Data Gateway - Direct Access to load data from on-premise into a Qlik Cloud tenant. The supported databases, the Generic ODBC Connector Package, together with the upcoming support for loading on-premise files, can allow you to decommission Qlik DataTransfer servers (and potentially repurpose them for gateways).
For more information, see Qlik Data Gateway - Direct Access.
Thank you for choosing Qlik,
Qlik Support -
Monitor Visualizations in the Cloud Hub
Did you know that you can monitor visualizations in the cloud hub? Visualizations from sheets in an app and from Insight Advisor can be selected for monitoring. Once selected, these visualizations will appear in the cloud hub in the Your charts section on the Home page and under Charts on the Explore page. Charts can be saved with or without selections and are refreshed every time the source app reloads. Let’s look at how it is done.In the image ... Show MoreDid you know that you can monitor visualizations in the cloud hub? Visualizations from sheets in an app and from Insight Advisor can be selected for monitoring. Once selected, these visualizations will appear in the cloud hub in the Your charts section on the Home page and under Charts on the Explore page. Charts can be saved with or without selections and are refreshed every time the source app reloads. Let’s look at how it is done.
In the image below, the bar chart is on a sheet in my app. Right click on the chart and then click on the eclipse (…) to see the Monitor in hub option displayed below. In the Insight Advisor, the eclipse is in the top right of the chart. Any selections applied to the chart will be saved and applied to the chart that you are monitoring.
What is nice about this is you can keep an eye on a specific chart without having to open the app and navigate to the visualization. The latest reloaded version of the chart is always the one that is visible in your cloud hub as seen below.
If you want to look at the chart in the app, that is easy to do. When you hover over the chart, there are 2 options: View chart and View in app. View chart will open the latest reloaded version of the chart. Selections cannot be made from here, but they can be made if View in the app is selected. View in the app will open the chart in the app or in Insight Advisor depending on where the source chart was selected. From Home or Explore, you can also click on the eclipse in the lower right of the chart to:
- See details about the chart such as the reload history
- Add the chart to a collection
- Edit some properties of the chart
- Delete the chart from monitoring
Another nice feature is you can compare versions of the chart. To do this, select the View chart option. From here, you can not only see the latest version of the chart you are monitoring but you can view previous versions of the chart. You can also compare 2 versions of the chart. When you hover over a chart in the Chart history section that is not selected, you will see a 1 and/or 2 in the right top corner of the chart. Selecting 1 will move the chart to the left side of the selected chart for comparison. Selecting 2 will move the chart to the right side of the selected chart for comparison. In the image below, the latest reloaded chart is selected and when I hover over the previous chart, I can see the 2 in the upper right that I can select if I want to compare it to the selected visualization.
Monitoring your charts in your personal space in the cloud hub gives you a new level of flexibility and allows you to see what visualizations are important to you quickly with options to explore them further, if needed. Check out Michael Tarallo's Qlik Sense in 60 - Chart Monitoring video to quickly see how it is done and see Qlik Help for more information on monitoring your visualizations in the cloud hub.
Thanks!