Announcements
Qlik Connect 2024! Seize endless possibilities! LEARN MORE
hic
Former Employee
Former Employee

If you want to display an average number of something in QlikView, you should use the Avg() function, right?


Wrong.


Yes, there is an Avg() function that returns the average value, but – this is usually not the value that you are looking for. The Avg() function returns the average transactional value, whereas you probably are looking for a larger amount.


For example, let’s say that you have an orders database where the grain - the most atomic level – of the data is Order Line. Each order can have several order lines and each order line has an amount. Then, the Avg() function will return the average order line amount, which is utterly uninteresting. No, you are most likely more interested in questions like “How much do we sell per month, on the average?”


In other words – a calculation of an average has an implicit internal grouping entity; the average per month, per day, per order, per delivery or something else. You can look at it as a two-step aggregation:


  1. Sum all the amounts – per each value of the internal grouping entity (e.g. month, day, order or delivery)
  2. Calculate the average of the sums from previous bullet.


In QlikView, you would calculate the average monthly sales value in one of the two following ways:


     Sum( Amount ) / Count( distinct MonthID )
     Avg( Aggr( Sum(Amount), MonthID ) )


… and similarly for orders, days or deliveries. Use of the Aggr() function will work, but it is not as fast as the first option, and should therefore be avoided.


Sometimes there are several internal grouping entities. You may for instance want to show the average monthly sales value per customer, i.e. you want to use both month and customer as grouping entity. Then you should use one of the following expressions:


     Sum( Amount ) / Count( distinct MonthID & '|' & CustomerID )
     Avg( Aggr( Sum(Amount), MonthID, CustomerID ) )


The Count() aggregation with a string concatenation will find every unique combination of month and customer.


Note that the internal grouping entity has nothing to do with the dimension you choose to use when you display it. It would make perfect sense to show the above number using Product as the only dimension, as shown in the graph below. Hence, the internal grouping entity is not necessarily visible in the end result.
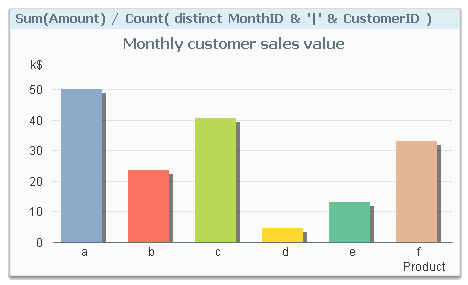
 

Average graph.png


So, you need to figure out which internal grouping entity you want and then use this in a smart way in your expression.


And by the way – an internal grouping entity can be used also for other aggregation functions: Smallest, largest, most common: Min(), Max(), Mode(). But for these, you will need to use the Aggr() function.


HIC

32 Comments
Anonymous
Not applicable

Hi Henric

It's very interesting how you use the combination of two dimensions in the Count function to avoid using the Aggr and I'll definitely remember it. I usually find that I want to calculate the average only for dimensions which have values as the others don't show up on the chart if you've got Suppres Zero Values ticked and then have to use set analysis to calculate it. But that can also easily be incorporated in your Count function.

Thanks for the post!

12,335 Views
cesaraccardi
Specialist
Specialist

Hi Henric,

What's the difference between the 2 expressions when it comes to performance? I've used aggr many times in my projects and I am not sure about the performance impact when you are working with huge amounts of data... Great explanation by the way.

Cheers

12,334 Views
hic
Former Employee
Former Employee

My experience is that Aggr() always is slower. The distinct in the Count() also has a penalty, but it is usually not as bad.

HIC

12,334 Views
Anonymous
Not applicable

very good post, thanks HIC!

talking about performance and your recent post on Distinct count testing, do you mind to write a post on how to do performance testing in QV?

I asked a question How to do performance testing in QV but no one replied yet.

0 Likes
12,335 Views
Not applicable

Very Helpful again Henric. However for zero value months, these are being omitted from my calculation. How would I include these?

0 Likes
12,335 Views
hic
Former Employee
Former Employee

If a month has a transaction with zero value, it will be included. But the more likely scenario is that the month does not have any transaction, and then it will not be included.

What you can do to force the month to be included, is to use Set Analysis. The following could serve as example:

   Sum( Amount ) / Count( {1} distinct MonthID )


However, this expression will include all months, whereas you may want QlikView to include some but not all of them. And this can be tricky: If a month is excluded by a selection, it's Excluded. Full stop. There is no way for QlikView to know whether this was intended or not.


A work-around could be to include a zero-value transaction for each combination of month and product, already when loading data. Then we are back to the first sentence of this answer.


HIC

12,335 Views
Anonymous
Not applicable

Thanks !! , nice and beautifully explained!!

0 Likes
10,066 Views
marksmunich
Creator III
Creator III

Hello Henric,

Can i do it so,

Avg(AGGR(Max(enddate)-Min(Smartdate),Fieldname) as AvgValuename in Scripting

or simple = Avg(AGGR(Max(enddate)-Min(Smartdate),Fieldname) in text object.

Is it correct.


0 Likes
10,066 Views
Not applicable

Hello all,

can you see following this link my question regarding the AVG function :

Average 30 last days for each date selected

Thanks in advance for your help

regards

0 Likes
10,066 Views
Not applicable

Great post! I read through it but apparently still need help. The below expression works as expected within a straight table. I have set the Total mode within the expression to be "Avg of Rows" and on the Number tab for the value to show as Percent.

I now want to also use this same expression in a Text Object. When I drop this expression into a Text Object I am not getting the correct result (getting a higher percentage). I have tried different permutations of using AVG, AGGR and others....so I am clearly missing something. What do I need to adjust in the Text Object to make this render the same result as within in a straight table??

Straight Table --> =$(vBillableCount) / ($(vBillableCount) + sum([NonBillable]))

Text Object --> =num($(vBillableCount) / ($(vBillableCount) + sum([NonBillable])), '##.00%')

0 Likes
10,066 Views