Unlock a world of possibilities! Login now and discover the exclusive benefits awaiting you.
Recent Documents
-
Compare Infoproviders between BW HANA environments using Gold Client BW
Compare Infoproviders between BW HANA environments using Gold Client BW One of the most asked and key features of Gold client BW is to provide the use... Show MoreCompare Infoproviders between BW HANA environments using Gold Client BW
One of the most asked and key features of Gold client BW is to provide the users with a feature to Compare infoproviders between two BW HANA environments. This unique feature also list’s out the differences of the object between the two environments.
The function allows the comparison of various types of Infoproviders like Info Objects, Info Cubes, DSO and ADSO’s structures and properties between the current BW system and a target BW system.
Upon entering one or multiple Info Objects, Info Cubes, DSO’s or ADSO’s the function will compare the structure and properties of the same against the Info Objects, Info Cubes, DSO’s and ADSO’s in the target system specified by the user.
Example:
Source BW Environment = A4H(BWonHANA)
Target BW Environment = BW2(BW4HANA)
infoprovider to be compared between two BW environments = 0MATERIAL
Login to the source BW system which in this example is A4H and use the tcode ZGOLDBW for Gold Client BW
Click on Compare Info provider button under the Infoprovider Equalizer section as shown in the figure below
In the next screen we need to provide the details of the info provider which we would like to compare with the Target BW system. Below are the steps to be followed
Compare Info Provider for on your target system.
- Select InfoObject radio button from the Info Provider type
- Enter InfoObject(s) in the Info Provider Selection which in this case is 0MATERIAL
- Enter the RFC destination of the BW system the Info Object is being compared to – Which in this example is BW2
- Press the Execute button
Once the execute button is pressed the user will be asked to login to the target BW system which in this example is BW2
After logging in successfully, the system will compare the infoprovider between the two BW environments and will list out the differences of the infoprovider between the environments.
In the below example of 0MAERIAL we can see that the length, output length, number of attributes and the attributes which is missing or differ from the source BW system will be displayed.
Similar to 0MATERIAL the user’s will be able to compare the below different types of infoprovider between two BW HANA and BW Non-HANA environments
- Info Object
- Info Cube
- Data store Objects
- Advance Data store objects
Environment
-
When a table contains more than what is needed (i.e. only valued fields)
Hi,have you ever needed to delete the fields of a table with hundreds of columns that were actually unused (i.e., empty or zero)?Here is the function ... Show MoreHi,
have you ever needed to delete the fields of a table with hundreds of columns that were actually unused (i.e., empty or zero)?
Here is the function that will INSTANTLY allow you to remove the columns without values:sub ClearFields(tName) //pass the table name AFTER a Load *... let cancellati=0; let totfield=NoOfFields('$(tName)'); let vElenco=''; for i=0 to totfield let vFName = PurgeChar(FieldName($(i),'$(tName)'),'[]"'); let vCnt=FieldValueCount('$(vFName)'); if vCnt=1 then vElenco = vElenco & ',[$(vFName)]'; let cancellati=cancellati+1; end if next i if cancellati>0 then vElenco = mid(vElenco,2); drop fields $(vElenco) from $(tName); trace Tabella $(tName): cancellati $(cancellati) campi su $(totfield) iniziali presenti; else trace Table $(tName): nessun campo eliminato su $(totfield); end if end sub -
Task Monitoring with PRTG
Monitoring of Tasks that reload Apps in Qlik Sense.One or more tasks are scheduled on the Qlik server that automatically load the Apps,The goal is to ... Show MoreMonitoring of Tasks that reload Apps in Qlik Sense.
One or more tasks are scheduled on the Qlik server that automatically load the Apps,
The goal is to be able to query the status of a task with the help of REST API technology and integrate it with the PRTG monitoring system.Step 1 -> Creation of a dedicated Virtual Proxy in Qlik QMC.
The documentation to be able to proceed is available from the following link:
Step 2 -> API Query Mode and Test.
Once the JWT virtual proxy has been configured and the validity of the Token has been verified as per the official guide, it is possible to proceed with the desired query.
NB. In this case we validated the token using a Service user who also runs all the dedicated services including the Proxy Service.
In this case we will monitor the correct reload of the tasks on the QLIK server, the Tasks are scheduled on the server and allow the App data to be reloaded.
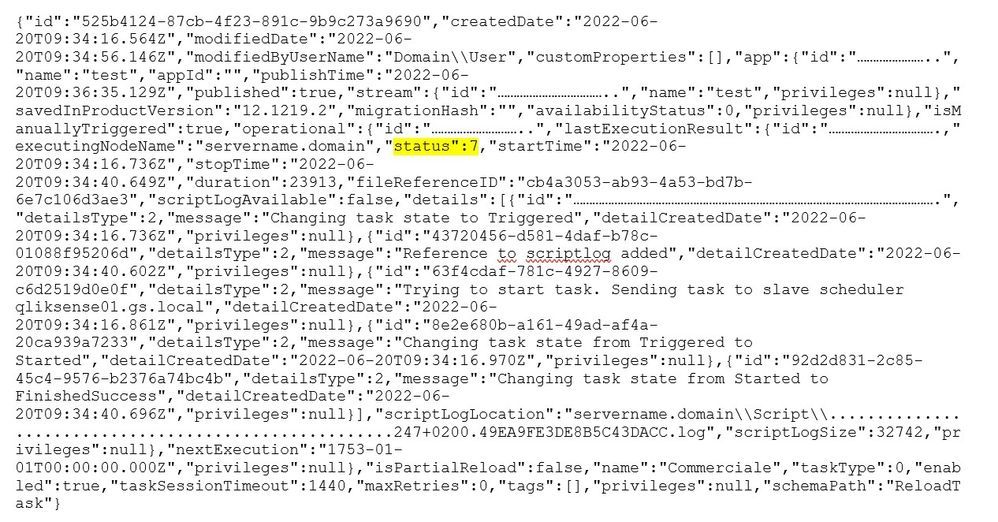
When one of these tasks fails via API call, it is possible to have a json result with the related details inside.
Below is an example of an API call:This is an example of a task we want to monitor:
A quick method to test if the call was successful is from the browser using the Mode Header extension for google chrome described in step 1.
https://chrome.google.com/webstore/detail/modheader-modify-http-hea/idgpnmonknjnojddfkpgkljpfnnfcklj
So for the call to be successful you need to pass the following parameters:
Where Header name: Authorization and Header value: Bearer followed by the previously generated and tested Token and finally the Xrfkey key.This will be the result in Json format returned by the browser if the call is successful:
Specifically in PRTG what we are going to monitor is:- The name of the Task in this case "test"
The status in this case"status":7 = Success - Task name "name": "Reload task of TEST TASK FAIL"
- Start and end time date:
"startTime": "2022-05-04T07:46:34.100Z"
"stopTime": "2022-05-04T07:46:37.636Z"3. Other information that we may integrate and otherwise see in PRTG.
NB. A table with Qlik Sense reload task status codes and descriptions is available from the following link
https://help.qlik.com/en-US/alerting/July2023/Content/QlikAlerting/system-alerts.htm
This is an example of the string JSON with ok API call.
Step 3 -> Task monitoring from PRTG.
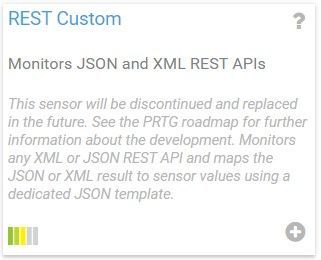
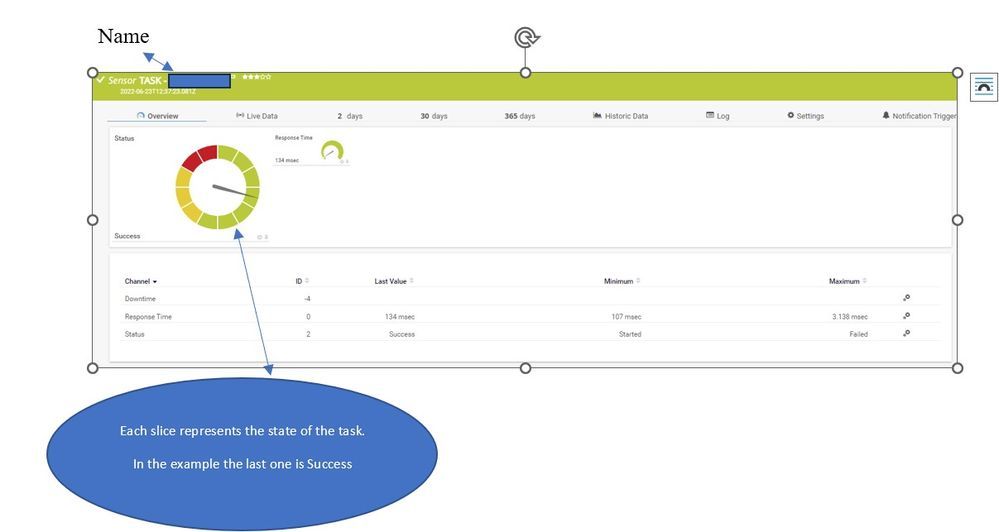
Type of sensor used in PRTG.
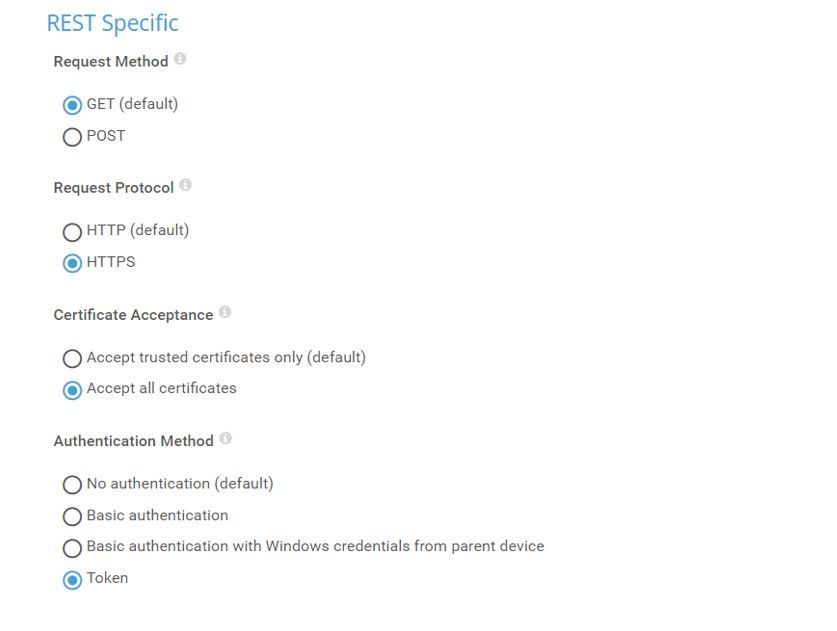
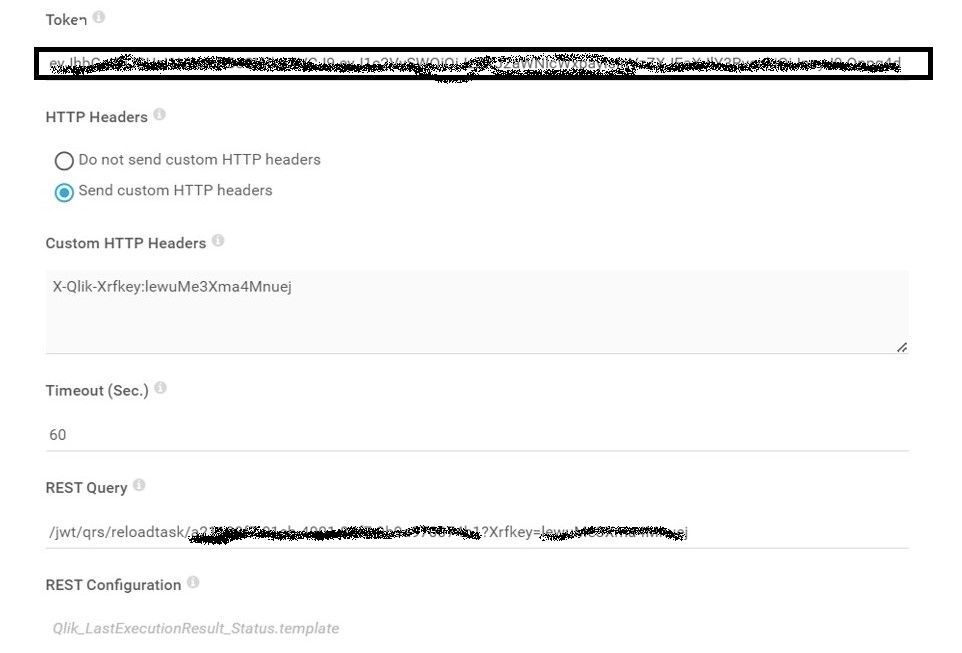
How to create a sensor.
The path on the PRTG server where the template is to be uploaded is as follows:
C:\Program Files (x86)\PRTG Network Monitor\Custom Sensors\rest
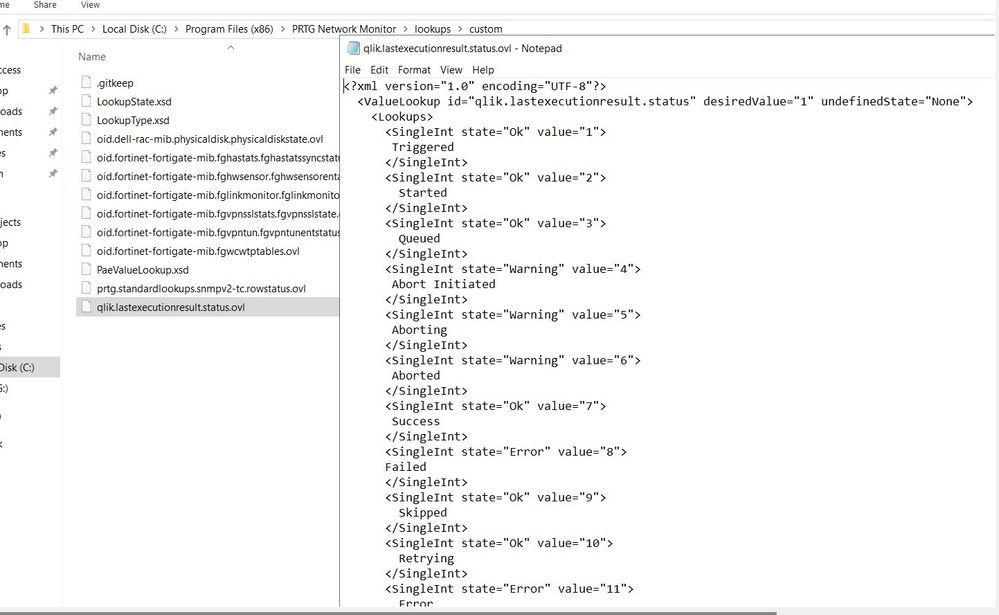
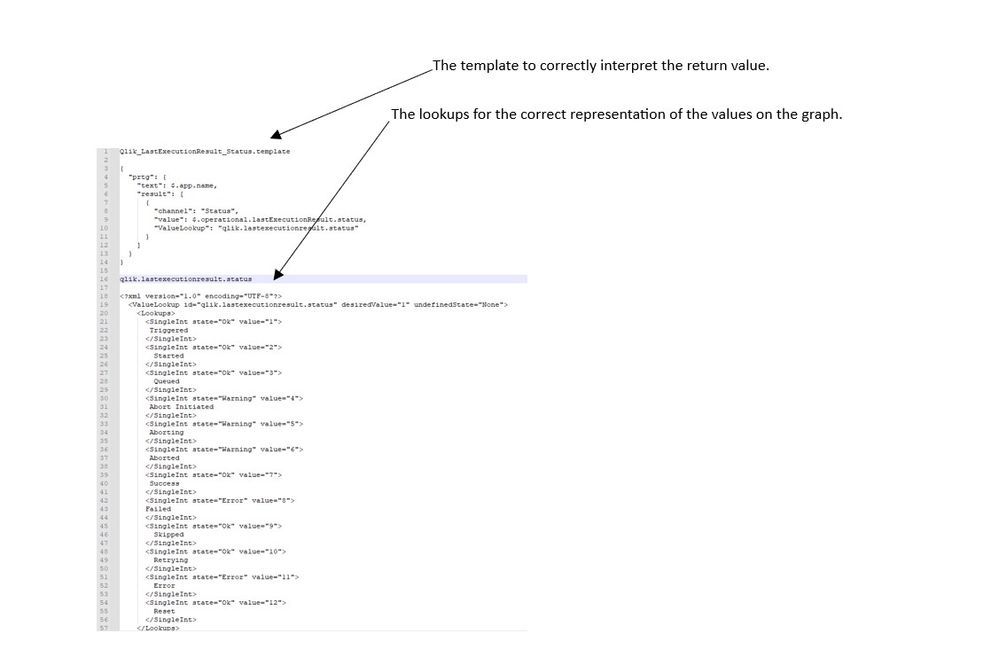
In the following path, however, it is necessary to define a Lookups in order to allow the sensor to interpret the various states of the Qlik Tasks listed in Step 2.
C:\Program Files (x86)\PRTG Network Monitor\lookups\custom
Result JSON query Task from Browser a part of this information will be used for the sensor in PRTG each task will correspond to a specific sensor.
The REST Custom Sensor was used in PRTG.
The REST Custom sensor queries a Representational State Transfer (REST) application programming interface (API) endpoint and maps the JavaScript Object Notation (JSON) or Extensible Markup Language (XML) result to the sensor values the mapping rule must be available as a REST configuration file in JSON template format (*.template) according to the PRTG API definition for custom sensors.Two files have been created on the PRTG server.
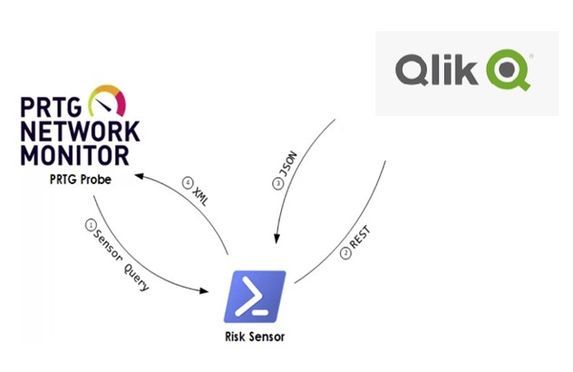
Final integration flow monitoring Task PRTG -> QLIK.
- The name of the Task in this case "test"
-
Create Simple Master Calendar - FY April
Hi , Please find attached below script will create master calendar FY April. Thanks Vikas -
Qlikview Access point showing QVW file name in lowercase instead of mixed case f...
Following upgrade from Qlikview 11.2 to 12.7, we've noticed that Access Point previously showed the qvw file name in mixed case, but now has in lower ... Show MoreFollowing upgrade from Qlikview 11.2 to 12.7, we've noticed that Access Point previously showed the qvw file name in mixed case, but now has in lower case.
Following screenshot shows example on old/new version.
Is there any way to revert to mixed case on latest version?
-
Welcome to the NEW area for member created articles
Welcome Qlik Community members! All logged-in members can share their expertise by adding a knowledge article and publishing it. You will need to cho... Show More -
QlikView NPrinting 16 Migration Playbook - A reference for migrating customers
The attached Migration Playbook is intended to be a consolidation of references for those who are on a QlikView NPrinting 16 to Qlik NPrinting 19 migr... Show MoreThe attached Migration Playbook is intended to be a consolidation of references for those who are on a QlikView NPrinting 16 to Qlik NPrinting 19 migration journey. It includes migration content from Qlik Community Posts, Qlik YouTube Channels, Qlik Support articles, Qlik Help site references, and guidance from the Qlik NPrinting product team. Read it from front to back or just selectively review the sections that relate to you - I hope you find this useful!
Reminder - this is relevant to QlikView NPrinting 16 customers only. If you are on Qlik NPrinting 17+ this guide is not for you.
For a wider view of additional and important migration considerations 'before' you migrate, please visit:
Updated April 28, 2020: change log in V2 document attached.


