Unlock a world of possibilities! Login now and discover the exclusive benefits awaiting you.
Analytics & AI
Forums for Qlik Analytic solutions. Ask questions, join discussions, find solutions, and access documentation and resources.
Data Integration & Quality
Forums for Qlik Data Integration solutions. Ask questions, join discussions, find solutions, and access documentation and resources
Explore Qlik Gallery
Qlik Gallery is meant to encourage Qlikkies everywhere to share their progress – from a first Qlik app – to a favorite Qlik app – and everything in-between.
Qlik Community
Get started on Qlik Community, find How-To documents, and join general non-product related discussions.
Qlik Resources
Direct links to other resources within the Qlik ecosystem. We suggest you bookmark this page.
Qlik Academic Program
Qlik gives qualified university students, educators, and researchers free Qlik software and resources to prepare students for the data-driven workplace.
Recent Blog Posts
-
Academic Program expanding in South India
Recently, the Academic Program has seen a good number of University enrollments from the South of India particularly in Bangalore and Coimbatore. Some... Show MoreRecently, the Academic Program has seen a good number of University enrollments from the South of India particularly in Bangalore and Coimbatore. Some of the top ranked higher educational institutions in the country are also from the South of India. In Bangalore, the academic program has a footprint in educational institutions such as BMSIT, Christ University, Jain University, SIBM Bangalore.
Coimbatore city which is one of the major hubs of higher education in the South has a presence of more than 50 institutions from engineering, management, medicine, pharmacy, arts and humanities faculties. The academic program has built its engagement with some of the well known Universities such as Hindusthan College of Engineering and Technology, Karpagam, Sri Krishna College of Technology, SREC, Kumaraguru College of Technology. Students and Professors from these institutions have enrolled for the program and continue to develop their data analytics skills through the resources offered under the program and pursue the path of data literacy.
-
Introducing Qlik Sense June 2017!
We are pleased to announce the release of Qlik Sense June 2017!With releases five times per year, it could be difficult to stay up to date on what’s n... Show MoreWe are pleased to announce the release of Qlik Sense June 2017!
With releases five times per year, it could be difficult to stay up to date on what’s new. The document attached to this post will help you keep up to date. You will find a look back at some of the key features released over the past 12 months as well as a detailed outline of the the most current release.
But first.... check out this overview video:
Some of the most exciting enhancements in this release include:
- New Visualizations – New visualizations including the Box Plot, Distribution Plot, and Histogram,
- Advanced Analytics Integration – The ability to call out to third party engines (such as R & Python) during analysis.
- Visual Data Prep Enhancements – A wide array of improvements to the visual data preparation capability of Qlik Sense including Visual Data Profiling, Data Binning, Visual Table Concatentation, Data Quality Transformations, Filtering, and inclusion of scripted data sets in visual data preparation.
- On Demand App Generation – User-generated on-demand analysis apps drawn from Big Data.
WHAT YOU SHOULD DO NEXT:
- Customers can visit the Qlik Customer Download Site HERE
- If you are new to Qlik, you can download the Qlik Sense June 2017 desktop version HERE.
- Stay informed and learn more by joining us on an upcoming webinar or local event.
-
My Pleasant Surprises - Qlik's Associative Difference
Hey Guys happy Tuesday! Today I will continue my series on some of my many pleasant surprises when first learning Qlik. My last pleasant surprise cove... Show More Hey Guys happy Tuesday! Today I will continue my series on some of my many pleasant surprises when first learning Qlik. My last pleasant surprise covered how Qlik creates data models without any complex data modeling skills and how the use of its metadata was a bit different from what I was use to - you can learn more about it here: My Pleasant Surprises Learning Qlik - a multi-part series. In this edition of the Qlik Design blog I cover one of our most important differentiators - the Qlik Associative Difference. By now you should know of my love for creating short succinct videos, and I personally feel they are more fun then reading walls of text - so in this entry I have embedded a video presentation and demonstration to show you Qlik's Associative Difference - thanks for watching,
Try the app here:
https://webapps.qlik.com/associative-difference/index.html
NOTE: To increase resolution or size of the video, select the YouTube logo at the bottom right of the player. You will be brought directly to YouTube where you can increase the resolution and size of the player window. Look for the 'settings' gears icon in the lower right of the player once at YouTube. (video and sample files)
For more videos that can help you get started with Qlik Sense:
-
What's New in Qlik Sense November 2017
Hey Guys - welcome to this week's Tuesday edition of the Qlik Design Blog. In this post we are excited to announce the availability of Qlik Sense Nove... Show MoreHey Guys - welcome to this week's Tuesday edition of the Qlik Design Blog. In this post we are excited to announce the availability of Qlik Sense November 2017. It has only been 2 months since our last release demonstrating our commitment to continuous and iterative improvements with our products. In this video I quickly breakdown what’s in the Qlik Sense November 2017 release. Included are some various chart improvements, new connectors and usability improvements to visual data preparation and the design interface. Let me know what you think, and leave a question or comment below.
Other videos for your viewing pleasure:
- Adding data manually: https://youtu.be/NprqnRWfveo
- Connecting Qlik Sense to Apache Hive: https://youtu.be/y8wl7Wtfwwo
- Dropbox Connector: Refreshing File-based Data and the New Dropbox Connector - Qlik Sense Cloud Business
NOTE: To increase resolution or size of the video, select the YouTube logo at the bottom right of the player. You will be brought directly to YouTube where you can increase the resolution and size of the player window. Look for the 'settings' gears icon in the lower right of the player once at YouTube.
Try Qlik Sense now: Try or Buy
Can't see the video? Download the .mp4 to watch on your computer or mobile device.
Regards,
-
Qlik Sense September 2017 - What's New
Hey guys, happy Tuesday! I'm pleased to be back in this edition of the Qlik Design Blog to introduce you to the September 2017 release of Qlik Sense..... Show More
Hey guys, happy Tuesday! I'm pleased to be back in this edition of the Qlik Design Blog to introduce you to the September 2017 release of Qlik Sense....right off the heels of hurricane Irma I might add. Florida (my home state) and its surrounding neighbors have been hit hard by this storm and I would like to first express my deepest sympathy for those that were affected by Irma's wrath. We will recover, as we always have, and by working together and supporting one another, we will be back on our feet in no time...oh and hurricane Maria, you better watch yourself Missy!) Now on to the show!
As we have previously mentioned, Qlik will be releasing software 5 times a year. Which equates to a new release about every 10 weeks or so. (You can learn more about our continuous release cycle by checking out this blog here: Qlik Sense® will release 5 times a year!)Rather than list the new feature highlights in this blog, I created a brief video to cover and demonstrate them. You can always check out the Qlik Sense release notes on the Qlik Help site as well as download the attach data sheet to learn more. You can also try these features right now by logging in to the Qlik Sense Cloud or by downloading a free version of Qlik Sense Desktop: Download Free Data Visualization Development Platform.
Now remember, each release will vary in capabilities and features, with some releases possibly having "more" in certain areas than others. It is important to note that the releases will not only cover Qlik Sense specifics, but other product areas such as Qlik NPrinting, Qlik GeoAnalytics, Qlik Sense Mobile, Qlik DataMarket, data connectors, API enhancements and new services and procedures. For example, with the September 2017 release we are also introducing a new Extension Certification Pilot program to allow extension authors to submit their extensions for review, to be certified and supported by the author for use within the Qlik platform. Stay tuned for more information on this pilot program to learn how you can submit your extension for certification.
NOTE - Qlik Sense Mobile: The app is available on the iOS VPP app store (Apple’s enterprise app store) this week.
This is a huge milestone for Qlik as it brings the power of our Associative Technology to the iPad, online AND offline. Customers and partners need to have signed up for Apple’s enterprise developer program to get access to the app. Once they are members of enterprise developer program, they can download the app from https://vpp.itunes.apple.com. Most medium and large business have this relationship with Apple and for those who do not, we are bringing the app to the iOS public app store in the near future, so hold tight.
Enjoy!
Regards,
Mike Tarallo
QlikAdditional Resources:
* To learn more about extensions - check out these videos:
* Did you miss what's new in our Qlik Sense June 2017 release? - Check it out here: Qlik Sense 2017 Releases - What's New
* More Videos
NOTE: To increase resolution or size of the video, select the YouTube logo at the bottom right of the player. You will be brought directly to YouTube where you can increase the resolution and size of the player window. Look for the 'settings' gears icon in the lower right of the player once at YouTube.
Can't see the video?
Download the .mp4 and watch from your computer or mobile device
-
The Academic Program at Saint Joseph's University
The Academic Program was onsite at Saint Joseph's University in Philadelphia to present Qlik Sense to students from the BIT (Business Information and ... Show More
The Academic Program was onsite at Saint Joseph's University in Philadelphia to present Qlik Sense to students from the BIT (Business Information and Technology) Society. The students consisted of Juniors and Seniors studying Business Analytics who are interested in learning more about Qlik Sense capabilities and everything the Academic Program has to offer.
The students were very impressed by Qlik's The Associative Differenceand they were eager to join the program because they indicated Qlik Sense looked more robust than other tools they have seen before.
The Qlik presenters included former Saint Joseph's Alumni and members of the Academic Program. The Qlik team attended several presentations that day including courses whose professors and students have already joined the program and are utilizing Qlik Sense.
If you are interested in hosting a Qlik presentation please email academicprogram@qlik.com
-
How to Prepare for a Certification Exam
Dear Qlik Community Members, If you are planning to take a QlikView or Qlik Sense Certification Exam, there are instructions and guidance for how to... Show MoreDear Qlik Community Members,
If you are planning to take a QlikView or Qlik Sense Certification Exam, there are instructions and guidance for how to prepare on the web pages.
Want to know the topics? Study the "Exam Domain Areas" - these are the topics used to write the exam questions.
These are EXPERT level exams, and hands-on experience in a production environment is usually needed to pass. The primary purpose of the exams is to validate the skills and knowledge of Qlik partners, so they can install, configure, develop, maintain and support Qlik products in an enterprise environment. Please know, using the QCC assessments are a good start to your learning, but these questions DO NOT represent the certification exam. There are FREE Certification Practice questions on the web pages under "Recommended Preparation Resources".
I'd like to remind you that discussing ANY Certification Exam content is a violation of the Qlik Certification Examination Access and Use Agreement, specifically paragraph 5, "Confidential Information and Ownership". If you need a refresher on the agreement accepted before you can register for an exam, here's a link: http://www.pearsonvue.com/qlikview/qlikview_nda.pdf
The exams are challenging, which gives the certifications value. If members discuss exam content, you are effectively reducing the value of your certification. Please keep ALL exam information confidential, or you risk having your certification revoked.
Thank you,
Karen Origlio
Certification Program Manager

-
Qlik NPrinting September 2017 Now Available
Qlik NPrinting September 2017 has been released to the customer download site. This release includes several key capabilities as described below. Re... Show MoreQlik NPrinting September 2017 has been released to the customer download site. This release includes several key capabilities as described below.
- Report Cycles - Qlik NPrinting September 2017 can generate a separate report file for each combination of one or more dimension values. Each report will be filtered according with the combination of values that generates it. For example, the report file generated for the combination Year = 2017 and Country = USA will contain only data related to USA in 2017. Each generated report file will have a unique and customizable filename. For this reason, the dynamic naming feature will be enabled every time you select cycling. This was a gap feature from Qlik NPrinting 16.
- Report Export/Import - It is possible to export a report into a compressed file and import it into a different installation of Qlik NPrinting 17. This is useful when you have separate development and production servers. Upgraded reports can be replaced in the final destination. Exported compressed files also contain other information related to the report, like users and filters.
- Object filters for Qlik Sense Charts - Allows you to apply a filter to a single Qlik Sense object like a chart without applying that filter to all objects in the report. It can also be used to block filtering of an object so that even though the rest of the report has filters applied, that object doesn't. Previously you could only add filters to QlikView charts. You can still add only one filter for each chart.
Customer can download the latest versions of our software on the Customer Download Page.

-
A picture is worth a thousand words
Student Supply Employer Demand According to a report published by the Business-Higher Education Forum BHEF, “…by 2021, 69% of em... Show MoreStudent Supply Employer Demand
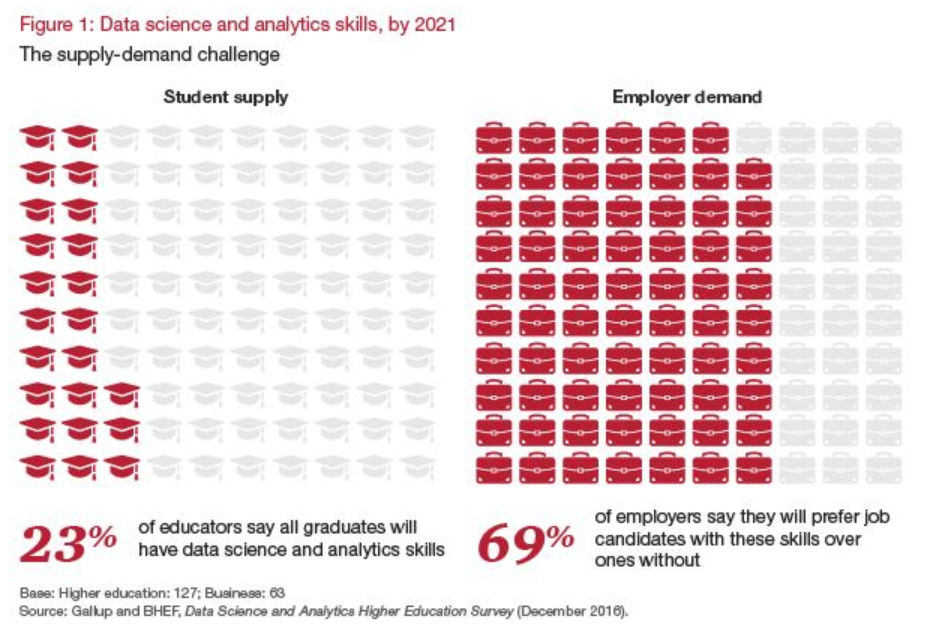
According to a report published by the Business-Higher Education Forum BHEF, “…by 2021, 69% of employers expect candidates with DSA skills to get preference for jobs in their organizations. Yet only 23% of college and university leaders say their graduates will have those skills.” It’s important to understand that this gap does not just apply to data scientists in training looking for jobs in Silicon Valley. We are all living in a big data world, and Data Science and Analytical skills will soon be fundamental at every level of the workforce from entry-level to CEO.
To help solve this skills gap the Academic Program provides FREE analytics training available in the Qlik Continuous Classroom and FREE Data Analytics Curriculum materials for professors and students to learn the what, why, and how of analytics. Access these resources by logging into the QCC using your Qlik username and selecting “Academic Program” on the top menu of the QCC homepage.
Share The Qlik Academic Program to friends or colleagues who are new to analytics and need a place to get started!
-
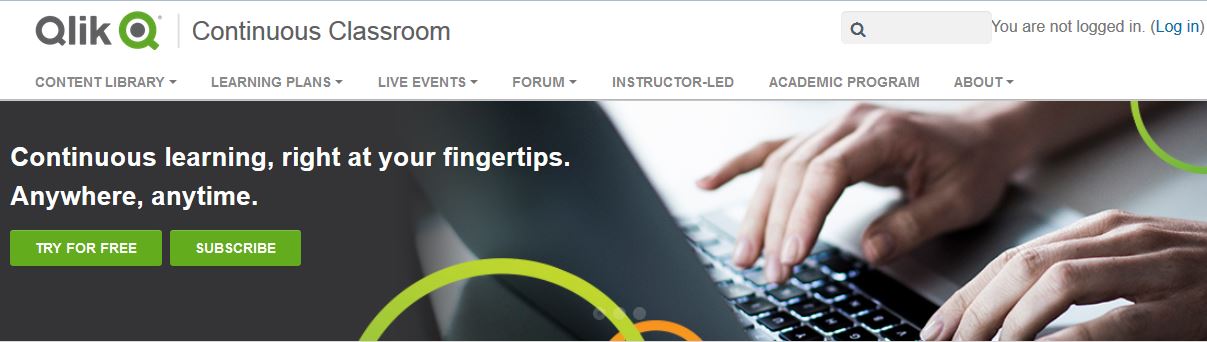
Continuous Classroom has a new look!
For all the Continuous Classroom users, and those of you who want to check out expertly created Qlik Training for free, go to qcc.qlik.com.Existing us... Show MoreFor all the Continuous Classroom users, and those of you who want to check out expertly created Qlik Training for free, go to qcc.qlik.com.
Existing users will notice that there are new tabs at the top of the page to help you navigate to the most important parts of the Continuous Classroom in order to get the most of your subscription. Easily access the libraries, learning plans, live webinar schedule, instructor Q&A sessions, and learn more about the platform.
Email questions and comments to ContinuousClassroom@qlik.com

-
The new Distribution plot
The Qlik Sense June 2017 release came with a bunch of new visualizations, distribution plot is one of the new objects available to drag and drop into ... Show MoreThe Qlik Sense June 2017 release came with a bunch of new visualizations, distribution plot is one of the new objects available to drag and drop into Qlik Sense. Let’s use an example to check what a distribution chart can tell us that was previously hidden from our eyes.
I’m going to use a very simple example of sales data, it contains 3 sales rep and monthly sales that extends over a year. We want to see how our reps are preforming over the year by observing some execution indicators such as total sales and average sales.
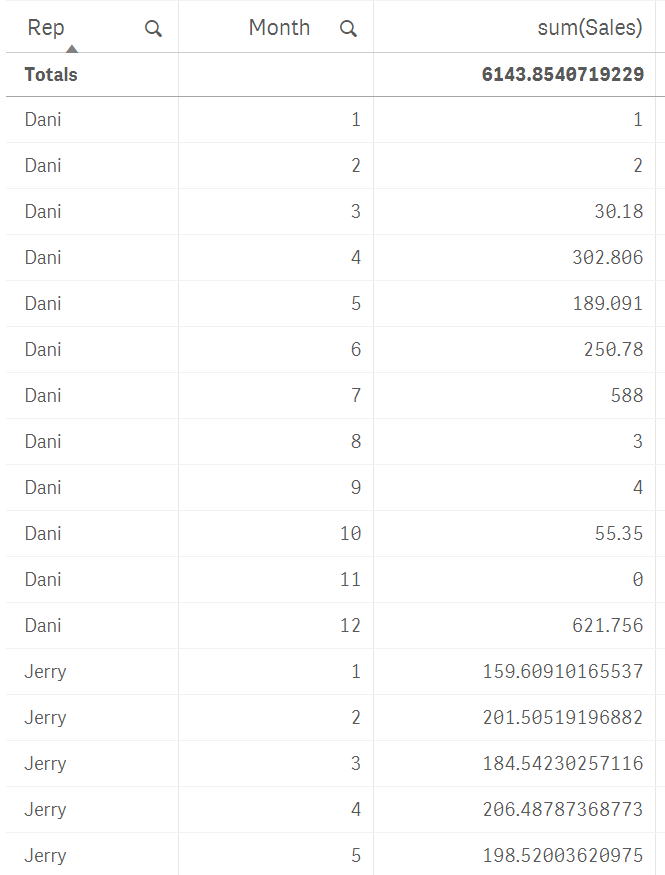
In our not-so-random example data, sales are even for the sales team. As you can see in the picture below, their aggregated numbers are almost identical.
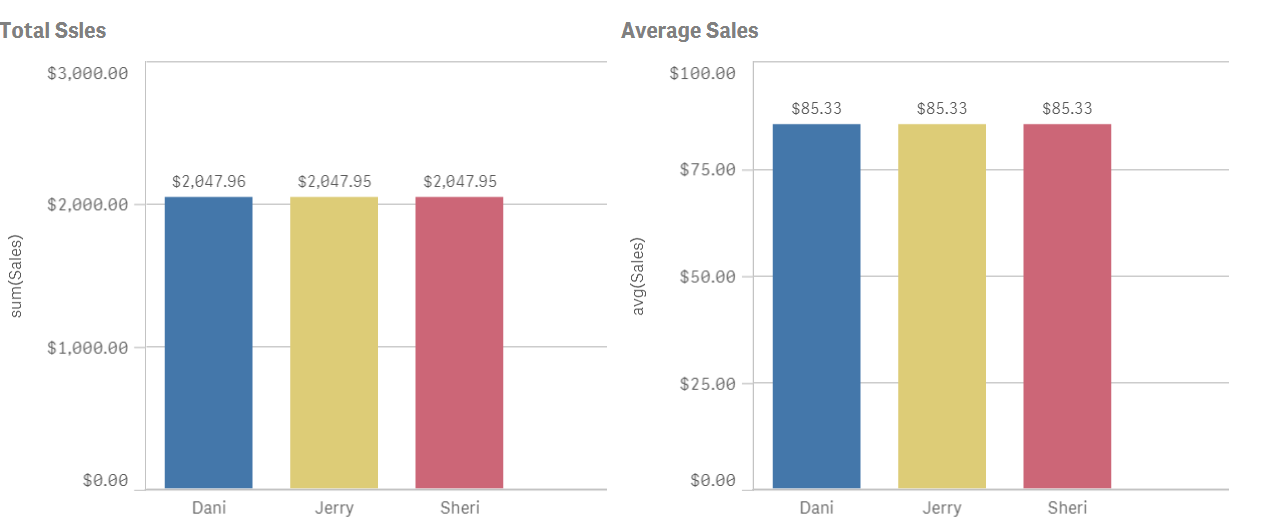
Average is just not enough to see how sales rep are performing, we need more granularity if we really want to understand how the sales process works. To do so we could try to include months and maybe use a different visualization object like a line chart.
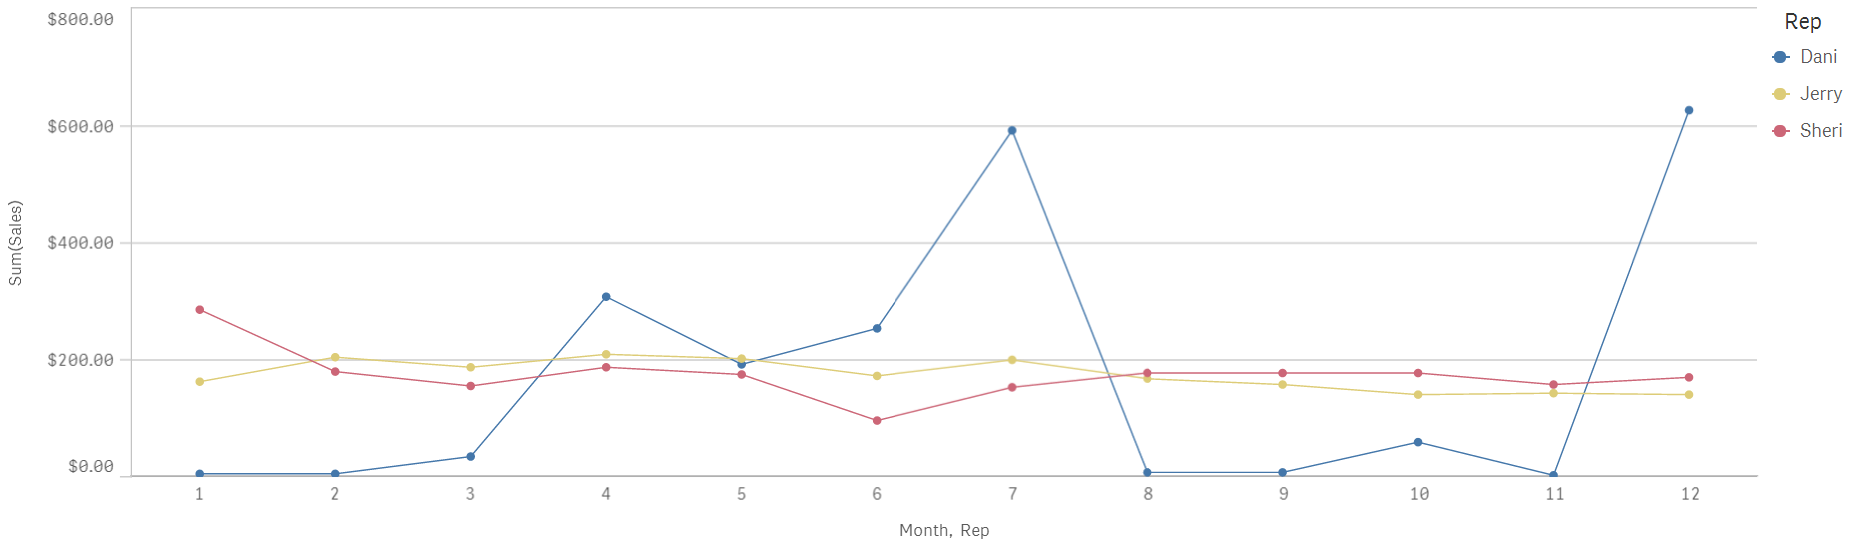
Line chart will help us to see sales with a temporal component, I see how both Jerry and Sheri have a very regular sales process over the months while Dani's go all over the board with excellent months and not so great ones.
Distribution plot can help me to get a better picture of our sales by giving us a glance of data dispersion.
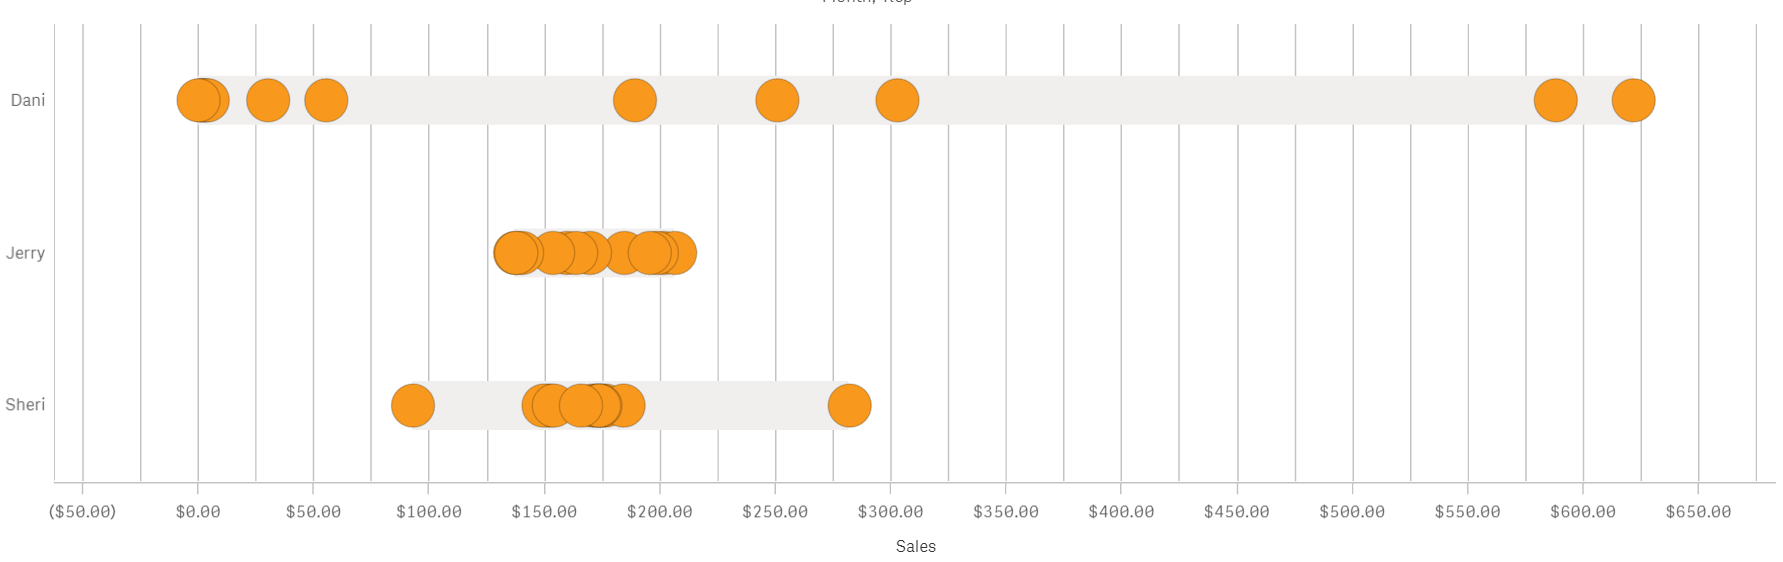
I see that despite having the same yearly sales amount and sales average the actual distribution over time is quite different from each other.
Jerry has tight sales performance month to month with all the points(months) falling in a compact cluster. Sheri meanwhile has a very tight bucket of dots a little over $150 but also a couple of months that could be considered as outliers. That is valuable information that wasn’t obvious only attending to the line chart.
Dani's sales don’t follow the pattern described by the other two individuals. For Dani, monthly sales range from $0 to $600 is either an excellent or a terrible month. Any company will be happier with a more consistent sales performance and our imaginary company is no exception to that. By learning how each one of the sales team performs we can take the necessary actions to help Dani to be more reliable.
As we have seen similar yearly sales and identical sales average could hide some valuable information, there’s a story in your data that needs to be discovered.
Enjoy it,
Arturo (@arturoqv)

-
How IntervalMatch Solved My Profit and Loss Dilemma
Of the 2 ½ years I have been with QlikTech, I have never had to use the IntervalMatch prefix in any of my scripts but I recently found out how powerfu... Show MoreOf the 2 ½ years I have been with QlikTech, I have never had to use the IntervalMatch prefix in any of my scripts but I recently found out how powerful it can be. I was tasked with creating a Profit and Loss (P&L) statement in QlikView based on the format outlined in this Excel file.
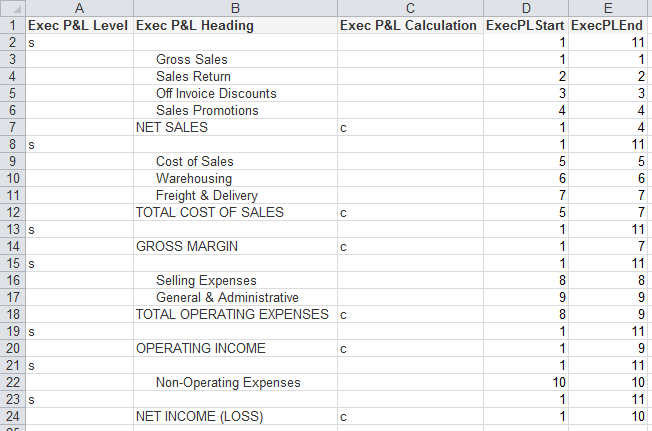
- The “s” in the Exec P&L Level column indicates blank rows
- The “c” in the Exec P&L Calculation column indicates rows where a calculation needs to be performed
- The Exec P&L Heading column stores the headings that are to be used in the P&L statement
- The ExecPLStart and ExecPLEnd columns indicate the range of rows that are to be summed
Who would have thought something as simple as IntervalMatch would solve my problem? I have always said that I learn something new about QlikView every day and this day was no different. I was able to load my master account information, my account balance information and then perform the IntervalMatch, using the reporting code field from the master account table, to get everything in sync so that the correct rows were summed in the P&L statement. Then all I needed to do was create my chart (a straight table) in QlikView. In the end my chart looked like the image below and I was quite pleased.
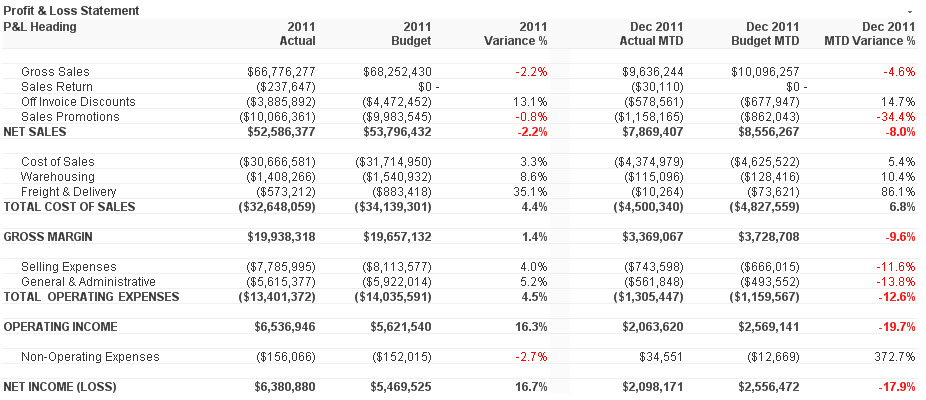
I wrote a technical brief about how I completed this task. I know this is just one of the many ways IntervalMatch can be used. I am sure in the future I will learn some of the other ways.
-
Data Literacy: The Results Are In
Data literacy is a journey, one that students and professors are starting to attack head on. Thanks to the Academic Program, professors and students c... Show More
Data literacy is a journey, one that students and professors are starting to attack head on.
Thanks to the Academic Program, professors and students can become data literate for free! If you don't have an active membership we encourage you and others to visit The Qlik Academic Program to apply!
To read the new article about Data Literacy visit https://blog.qlik.com/data-literacy-the-results-are-in
-
My Pleasant Surprises Learning Qlik - a multi-part series
Coming from a traditional business intelligence and ETL background where I’ve used both proprietary and open source solutions – things like OLAP, data... Show More
Coming from a traditional business intelligence and ETL background where I’ve used both proprietary and open source solutions – things like OLAP, data modeling, SQL, 4GLs, semantic layers and even coding dashboards were commonplace for many years. So when I started with Qlik, I was not only thrilled, but quite biased towards the way I manged and created analytics . As I set out to build my first Qlik application I immediately had many questions:- Where do I build my semantic / metadata layer?
- Where is my data modeler tool to define my table relationships?
- How do I place parameters to pass where-conditions to my database?
- How do I wire my visualizations to make my dashboards interactive?
As I set out on this journey to appreciate Qlik, I was surprised at what I found. In this multi-part blog series I will share with you some of my pleasant surprises that changed the way I create and work with analytics.
So let’s dive in further to my first Qlik pleasant surprise.
#1: Where's the "Semantic Layer"?!
NOTE: The subject matter in this topic can have many moving parts and is not meant to be a direct comparison to traditional BI or other data visualization tools. It is an expression of my experiences when first working with Qlik and meant to inform those who might have similar expectations when comparing Qlik to other BI tools.
A typical first step when using BI tools is that you usually create a metadata or semantic layer before you can begin creating your reports and dashboards. Depending on the tools being used, sometimes you even need to create more than one…one layer to support operational reporting and one to support interactive OLAP. (Often when a vendor's software stack combines a number of acquired tools, you may see this occur.) Creating abstraction layers such as these are usually performed by BI administrators whom are familiar with the data. Metadata / semantic layers provide a unified, consolidated view of data across the organization. They are important middlemen that connect back-end data to BI client tools and add a layer of governance and security. These centralized repositories store many attributes of your data including specific attributes used by the tools:
- Connection information
- Business friendly field names
- Field and row-level security
- Aggregations
- Data modeling properties such as keys, and referential integrity
- Calculated expressions
Once a semantic layer is prepared, the BI client tools can begin using the "data models", "business objects", "data dictionary" etc, to create reports and dashboards.
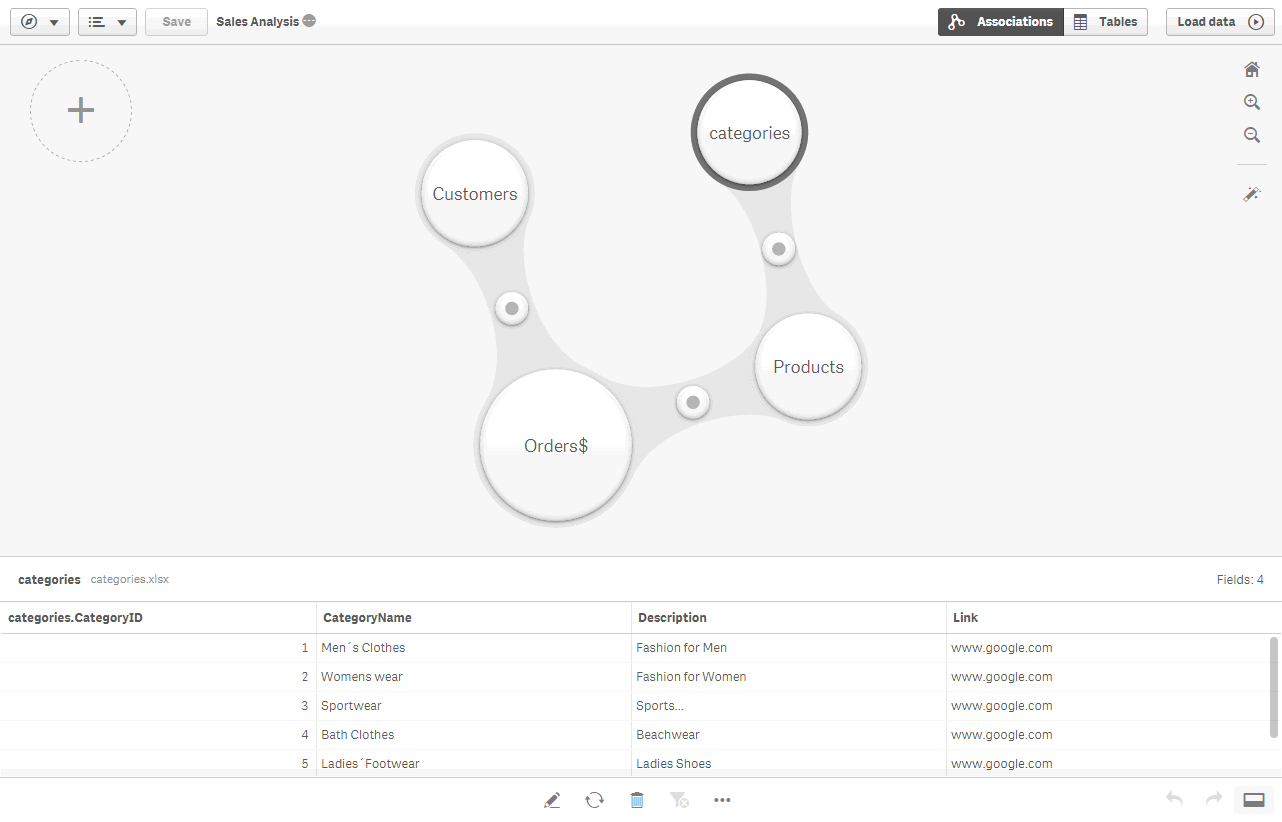
Now, when I started working with Qlik, I was unsure how this step was performed -OR- perhaps what I was doing seemed more transparent and less rigid than what I was used to. For starters I could quickly load data directly from many sources and go directly into my analysis. Qlik simply loads and indexes data into its apps during the app creation. These apps then operate within an associative indexing engine. (more on that in another article) - If I wanted to add multiple sources, I can visually profile the data and define relationships automatically - no complex data modeling or SQL required. I did not need to worry if I was "joining" correctly or even understand the relationships of the tables. I found this to be a huge time-saver and the process was fairly simple to navigate. This was indeed a pleasant surprise.
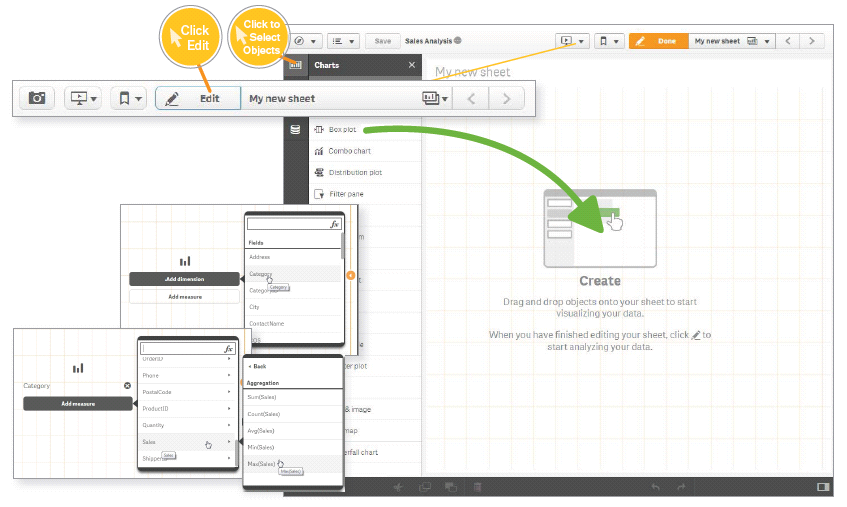
Once the data was loaded into the app, I immediately had access to my fields and could begin creating my analysis. In addition, I discovered that I can also set up reusable expressions, measures, dimensions and even predefined visualizations, through a feature known as Master Items. Master Items are defined in the Qlik Sense App rather than a centralized server. They allow business users to use a pre-defined library of assets so they can easily create and customize visualizations. (Note: Master Items are more beneficial to users of Qlik Sense Enterprise as opposed to those using Qlik Sense Desktop.)
This was a pleasant surprise as it was extremely easy to get started with Qlik and cut my data preparation time significantly, in turn giving me more time to create my analysis.So basically, I discovered that Qlik, defines its "semantic layer" within the app itself, as opposed to a separate repository?!? Hmmm.....
A healthy debate ensues
To some degree, I understand there are some opinions about this approach, and some may say "That's not a semantic layer". Now there are ways that you can export a Qlik data model and data index, created within the app, to disk (.qvd) and use them with other applications. This has been done widely and successfully by many of our customers. But...with the new Master Items approach introduced in Qlik Sense, we needed a way to centralized those assets for other applications as well, so our team of experts have created a Qlik Powertool, the Governed Metrics Service.
"The Governed Metrics Service (GMS) Powertool provides the ability to control and provision the use of governed Master Items. GMS loads externally defined metrics and applies them to one or more designated applications. GMS will quickly have you on the right track to governed self-service."
To learn more about GMS check it out here: Introduction - EA Powertools Governed Metrics Service
My journey with Qlik is no where near completed and I anticipated many more pleasant surprises. Next week I'll cover another pleasant Qlik surprise that helped me uncover things in my data I had not idea existed. Have a comment or question, a pleasant surprise you want to share? We want to hear from you. Use the comments section below to ask a question and join the discussion.
Regards,
Michael Tarallo (@mtarallo) | Twitter
QlikFor starters, if you are a visual learner and new to Qlik, take a look at this brief video to get an idea of how to provision from multiple tables using Qlik Sense:
NOTE: To increase resolution or size of the video, select the YouTube logo at the bottom right of the player. You will be brought directly to YouTube where you can increase the resolution and size of the player window. Look for the 'settings' gears icon in the lower right of the player once at YouTube. (video and sample files)
For more videos that can help you get started with Qlik Sense:
-
Qlik Web Connectors for Qlik Sense, QlikView and Cloud
Hey Guys! Thanks for taking a moment to read this blog and view the brief 60 second video on our Qlik Web Connectors. It is no surprise that we are su... Show More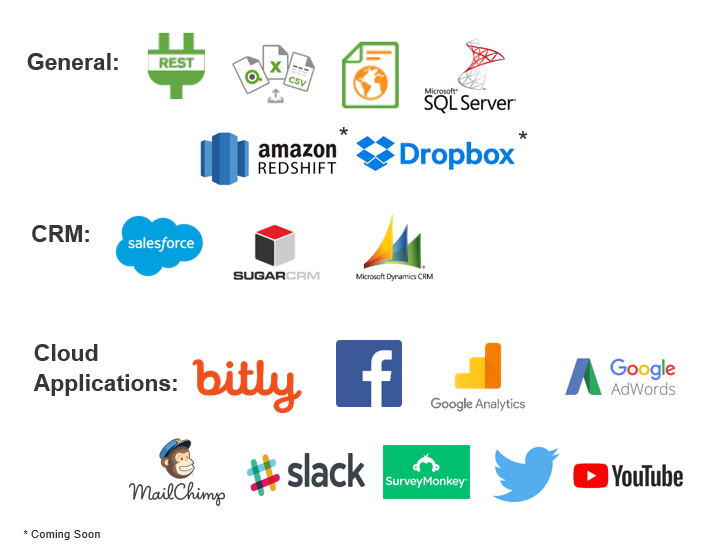 Hey Guys! Thanks for taking a moment to read this blog and view the brief 60 second video on our Qlik Web Connectors. It is no surprise that we are surrounded by mountains of data. But, what good is it if you don't have easy access to it? I'm not talking about data that sits in traditional files and databases. I'm talking about data that sits in numerous cloud-based services, social media and web sites.Depending on your business, this data can contain valuable insights that help you make better decisions as wells as customer sentiments that help improve your products and services.
Our Qlik Web Connectors is the answer to your additional data needs, whether its from a cloud-based CRM, data warehouse or social media application. Watch the below video to learn how simple it is to fetch this data and bring it directly into your Qlik Sense or QlikView environments. And...Qlik Sense Cloud Business subscribers, guess what, you have access it to them too!
Qlik Sense in 60 - Qlik Web Connectors
NOTE: To increase resolution or size of the video, select the YouTube logo at the bottom right of the player. You will be brought directly to YouTube where you can increase the resolution and size of the player window. Look for the 'settings' gears icon in the lower right of the player once at YouTube.
Qlik Sense Cloud Business Subscribers:
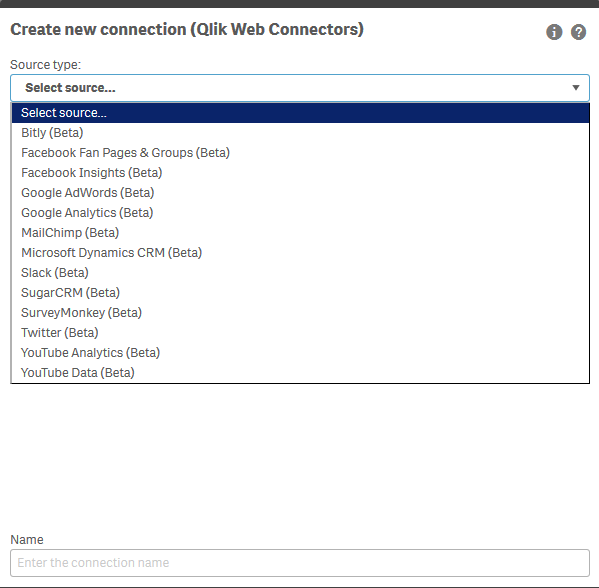
As stated in the video, Qlik Sense Cloud Business subscribers can also get immediate access to a great selection of many of our web connectors, with more being added on a regular basis. With Qlik Sense Cloud Business, subscribers can quickly and easily fetch data from many web-based sources with a new integrated connector selection list and query manager. The addition of these features, eliminates the need to copy and paste any script as you would when using the standalone Qlik Web Connector service.
How-To Videos
- Google Analytics - Qlik Sense Cloud Business Web Connectors - Video 1
- Twitter - Qlik Sense Cloud Business Web Connectors - Video 2
- Facebook - Qlik Sense Cloud Business Web Connectors - Video 3
For more information on a list of Web Connectors just released for Qlik Sense Cloud Business check out our recent announcement here: Getting More Connected in the CloudAdditional Web Connector Resources:
Learn more from my colleague Adam Mayer who shows some brief examples using Twiter, Facebook and Google Analytics:
- Qlik Snippets: Qlik Google Analytics Connector - YouTube
- Qlik Snippets: Qlik Facebook Fan Pages & Group Connector - YouTube
- Qlik Snippets: Qlik Twitter Connector - YouTube
- Web Connector on-line help documentation
We want to hear from you, so please join the conversation by posting your questions and comments below.
Regards,
Mike Tarallo
QlikCan't see the video?
Download the .mp4 and watch from your computer or mobile device
-
The Missing Piece of the Adoption Puzzle
Organizations everywhere are switching to cloud-based and subscription-based software to run their business. This presents some great benefits, but a... Show More
Organizations everywhere are switching to cloud-based and subscription-based software to run their business. This presents some great benefits, but also a new, significant challenge for user adoption.Cloud-based software is typically updated with the latest and greatest technology.This means that the users must continuous learn these new technologies and competencies to maximize value from the software.This also requires more of an investment in user adoption to make the software sticky for the users and for organizations to realize its value.At the same time, education and learning approaches are not keeping up and organizations are not adapting their learning to fit today’s ever-changing work environment.To keep pace, organizations need to think about user adoption and getting users properly enabled completely differently than before.
To read more visit the blog posted by the Vice President of Education Services, Kevin Hanegan
https://blog.qlik.com/the-missing-piece-of-the-adoption-puzzle
-
The Concat Function
QlikView has many useful and sometimes underused functions that can make your life as a developer a lot easier. One of these is CONCAT(). This should ... Show MoreQlikView has many useful and sometimes underused functions that can make your life as a developer a lot easier. One of these is CONCAT(). This should not be confused with the CONCATENATE script keyword.
In its simplest form, CONCAT() is used to string together values/words/selections in to one string. However, it can be utilized in a number of ways to help you solve different problems.
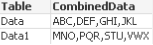
All of the examples in this post are based on the data in the table below.....
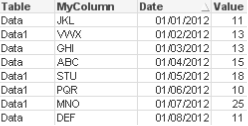
I have shown a few simple but useful examples below to hopefully help you in your everyday QlikView development!
Simple String Concatenation
As mentioned earlier, the function lets you string together a list of values. These values can be hard coded or driven my selections/data.
=CONCAT(MyColumn,',')
=CONCAT(DISTINCT MyColumn,',')
This simple concat statement would string together all of the possible values from the column MyColumn. You may wish to add the DISTINCT keyword. This would ensure that each value is only displayed once in the string.
ABC,DEF,GHI,JKL,MNO,PQR,STU,VWX
When using a simple concat, you have the option to add a sort weight to the function to order the string values by a column of your choice. In the example below, I have added the date column to sort the values…..
=CONCAT(MyColumn, ',', Date)
Result: JKL,VWX,GHI,ABC,STU,PQR,MNO,DEF
Concat() within an expression/set statement
There are occasions when you want to pass a selection of values to a set statement. To do this I would need to add some single quotes to the string so that the CONCAT() function returns e.g. 'JKL','VWX'. But you cannot have the single quotes as they are, since they then would be interpreted when the Concat is evaluated instead of when the set expression is evaluated. Instead I use the Chr() function:
=CONCAT(Chr(39)&MyColumn&Chr(39),',')
I can then pass this concat statement to the inside of an expression…
=Sum({<MyColumn={$(=CONCAT(Chr(39)&MyColumn&Chr(39),','))}>} Value)
In most instances, this technique would be used where data islands are present. It lets me pass values to an expression that will not affect any part of the data model as the data island table is not joined to it.
Concat() in the Script
Concat can also be utilised in the script to let you convert multiple rows in to one single column value, just as any other aggregation.
Remembering the source data we have earlier in the blog. The result of script side CONCAT can be seen below...
Using Rank() to influence the Concat()
When you start to utilise other function in conjunction with concat() you can start to achieve to clever results. In this example, I have used Rank() to grab the top 3 performers (based on Value) and string them together.
=CONCAT(IF(aggr(Rank(sum(Value)),MyColumn)<=3,MyColumn),',')
Result: ABC,MNO,STU
So as you can see, there are a number of uses for CONCAT(). Let's if you can find more!
For more information, please refer to the Technical Brief here.
ABY.

-
With Advanced Analytics, It's People (Not Data) That Stand In The Way Of Change
Now more than ever we are seeing the importance of learning what Data Analytics is and why its a crucial part of everyday business. Today students gr... Show More
Now more than ever we are seeing the importance of learning what Data Analytics is and why its a crucial part of everyday business. Today students graduating with a background in analytics are much more likely to be hired due to the lack of employees with analytical skills.
To further explain this idea, Forbes released an article recently highlighting the growing skills gap between analytics and employees.
To read the full article visit https://www.forbes.com/sites/baininsights/2017/10/16/with-advanced-analytics-its-people-not-data-that-stand-in-the-way-of-change/#49fb5a5a3d1c
To help solve this gap, the Academic Program has been teaching analytics to professor and students for a number of years! We encourage you to share all that Academic Program has to offer to professor and students so they too can learn the important skills needed to take advantage of this growing market!
-
QlikView November 2017 Technical Preview Release
Qlik customers & partners are invited to join the QlikView November 2017 Technical Preview. This Preview includes new features and improvements like:A... Show MoreQlik customers & partners are invited to join the QlikView November 2017 Technical Preview. This Preview includes new features and improvements like:
- Analytic connections - With analytic connections, you can integrate external analysis with your business discovery. By configuring an analytic connection (through server-side extensions), you can extend the built-in expression library with support for calling third-party calculation engines, both for load script and for chart expressions.
- WebClient improvements like switch language, Detach, Set reference, Copy single column selection, Copy cell
- Shared files management improvements - improved stability, shared file cleaning, PGO buffering
- Export in XLSX format - XLSX is now the default exporting format for Excel files, replacing XLS.
- BNF script reload mode - A new script reload mode, BNF, has been introduced. It uses the same syntax checks as those in the Script editor.
- KML support - QlikView now can read KML files for use in a map visualizations. The KML file can represent either area data, such as countries or regions, or point data such as cities or places.
- LEF Control on Maintenance date - When upgrading the QlikView Server or QlikView Desktop, LEF files must be up to date.
Try out these new capabilities and improvements and use the community to give your feedback on this new release of QlikView.
If you have any question or have issues accessing the community please send an email to insight@qlik.com.

-
Qlik Qualification for Students
Last week we announced our brand new Qlik Qualifications, now allowing students to use their QCC knowledge and in classroom BI experience to become an... Show MoreLast week we announced our brand new Qlik Qualifications, now allowing students to use their QCC knowledge and in classroom BI experience to become an academically qualified student as either a Business Analyst or a Data Architect.
But what is the difference between each pathway?
Business Analyst

This qualification exam tests your basic skills and applied knowledge of the Qlik Sense product.
Tested skills include building Qlik Sense visualisations for data analysis, creating master items for business user consumption, incorporating new data from text/Excel files, and understanding how to use and build bookmarks, snapshots and stories for collaboration.
Data Architect

This qualification exam tests your basic skills and applied knowledge of the Qlik Sense product.
Tested skills include understanding data modelling concepts, generating, debugging and troubleshooting the load script, incorporating new data using external files and data sources, and creating master items for business user consumption.
We're very excited to be able to offer this option for students and assist towards their careers in analytics or where ever that might be. The qualifications can be viewed on the QCC platform through the Academic Program tab.


