Unlock a world of possibilities! Login now and discover the exclusive benefits awaiting you.
All Forums
- Qlik Community
- :
- All Forums
- :
- popularResources
popularResources
Qlik Usefull Functions
Qlik Usefull Functions
Hi,
I have seen many posts on community for showing negative values on charts like Block chart, pie chart etc. There is a solution available on community, but I thought to create the document so that everyone can utilize the same.
Lets say I have below
...Hi,
I have seen many posts on community for showing negative values on charts like Block chart, pie chart etc. There is a solution available on community, but I thought to create the document so that everyone can utilize the same.
Lets say I have below data set
LOAD * INLINE [
Country, Score
US, 4971.765
UK, 4782.54
Japan, -200.941
India, 1412.181
Russia, 2445.292
];
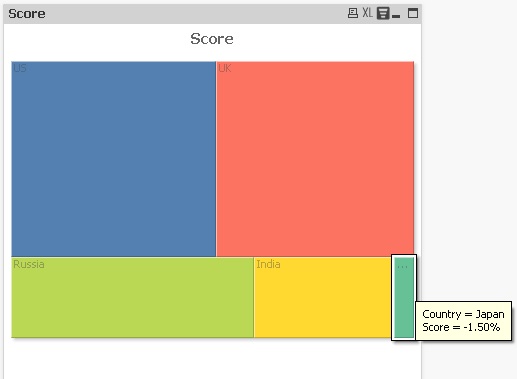
Now I want to create the Block chart with above data set. So create the block chart with dimension as country and expression as sum(Score) , as soon as you create the chart you will get the error message that "positive and negative values in chart". But you can still display the negative values on chart with slight modification in expression.
Steps to create the block chart with negative value
1) Create the block chart
Dimension : Country
Expression : dual(sum(Score),fabs(sum(Score)))
If you want to display the distribution in % then use below expression
dual(num(sum(Score)/sum(TOTAL Score),'#0.00%'),fabs(sum(Score)))
Using dual function you can display the negative value with the base as positive value.
2) Go to chart properties -> Number Tab and check the Number format setting always as "Expression default". If the number format setting is not the expression default then negative values will be displayed as positive and also data will be displayed in wrong format. So if you want to provide any format like %, money you can define in the Dual expression itself using num function
Please see the attached application. In this application I have used the Fast change option so that you can see the results for multiple chart type as well

see also,
Regards,
Kushal
- Tags:
- qlikview
- Labels:
-
App Development
-
Creating Analytics
Adjunto recopilación de los Hospitales, Centros de Salud y de Urgencias de España.
Está organizado por poblaciones, provincias y comunidades Autónomas
Espero que sea de utilidad
Saludos,
Enrique Colomer

Adjunto recopilación de los Hospitales, Centros de Salud y de Urgencias de España.
Está organizado por poblaciones, provincias y comunidades Autónomas
Espero que sea de utilidad
Saludos,
Enrique Colomer
- Labels:
-
QlikView
Hi everyone,
Here is a file to write the content of a QVD into an MS SQL database with minimum amount of coding.
The script uses bulk insert function in SQL and inserts 1,000 rows at a time.
(A few changes on the Qlik side, please refer to the Help File here for server configuration
...Hi everyone,
Here is a file to write the content of a QVD into an MS SQL database with minimum amount of coding.
The script uses bulk insert function in SQL and inserts 1,000 rows at a time.
(A few changes on the Qlik side, please refer to the Help File here for server configuration or here in a discussion post.)
There are instructions/assumptions in the front-end of the app.
- Ensure the source QVD has the columns correctly formatted on the first run (as it creates the SQL table based on the coded Qlik data types - even though Qlik data types technically don't exist) as this determines the 'data types' it builds into the SQL table.
- Replace the existing "CONNECT TO" string to the database server.
- Point to the QVD you want to write to SQL.
- Script will change/replace all special characters in data, table and field names. Underscore will replace any 'space' in table and field names and the latter 2 will be in 'all caps' to follow DB naming-convention.
- Script will create a table in the database (the database itself must exist or be created prior to launching the script).
- Re-run the script after the script has created the target SQL table and the script will (bulk) insert 1,000 rows at a time.
- File creates/updates one "DB_Write_Log.qvd" QVD with stats of what has been written to the SQL table by this script/file (keeps a historical record).
Tentative stats are: (a) Writes 1,000 rows (one insert) every 1.63 seconds for a table 7 columns deep; (b) Writes 45,637 rows in 58 seconds for a table 10 columns deep.
Hope you find this useful.
A video tutorial here: Qlik Bulk INSERT into SQL table - YouTube
Have fun,
C ;o)
Inspired through this question: General Q. and the solution which tresesco provided in the sub-link: how to convert number into words I thought that must be (easier) possible with QlikView itself. At first I considered to split the number with a whil
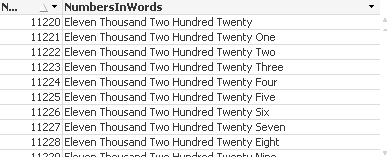
...Inspired through this question: General Q. and the solution which tresesco provided in the sub-link: how to convert number into words I thought that must be (easier) possible with QlikView itself. At first I considered to split the number with a while-loop and catch to each single-number then a mapping-value. But because of the slight inhomogeneity from the spelling words to the numbers it would be some checking with if-loops necessary. Therefore I deceided to make it more simple. It needs only two small mapping-tables and a preceeding-load in which each word-part oft he number will be separate generated and afterwards simple string-concatenated and a little bit cleaned.
This example is restricted to numbers < 1M but the logic could be extended. I hope I have caught every possibility by the translation - but don't hesitate if you find a error or if you have ideas for improvements. And this is the result:
Map_FirstNumbers:
mapping Load * Inline [
FirstNumbers, Text
1, one
2, two
3, three
4, four
5, five
6, six
7, seven
8, eight
9, nine
10, ten
11, eleven
12, twelve
13, thirteen
14, fourteen
15, fifteen
16, sixteen
17, seventeen
18, eighteen
19, nineteen
20, twenty
];
Map_SecondNumber:
mapping Load * Inline [
SecondNumber, Text
2, twenty
3, thirty
4, fourty
5, fifthy
6, sixty
7, seventy
8, eighty
9, ninety
];
NumbersInWords:
load *, capitalize(trim(replace(NumbersInWordsRawFormat, Repeat(Chr(32), 3), chr(32)))) as NumbersInWords;
load *, [6 value] & [6 unit] & [4+5 value] & [4-6 unit] & [3 value] & [3 unit] & [1+2 value] as NumbersInWordsRawFormat;
load *,
if(right(Number, 2) < 21, applymap('Map_FirstNumbers', right(Number, 2), chr(32)),
if(right(Number, 2) < 100, applymap('Map_SecondNumber', mid(right(Number, 2), 1, 1), chr(32)) & chr(32) &
applymap('Map_FirstNumbers', mid(right(Number, 2), 2, 1), chr(32)))) as [1+2 value],
if(LenNumber >= 3, applymap('Map_FirstNumbers', num#(mid(right(Number, 3), 1, 1)), chr(32)), chr(32)) as [3 value],
if(LenNumber >= 3 and num#(mid(right(Number, 3), 1, 1)) > 0, ' hundred ', chr(32)) as [3 unit],
if(match(LenNumber, 4, 5, 6),
if(LenNumber = 4, applymap('Map_FirstNumbers', num#(mid(right(Number, 4), 1, 1)), chr(32)),
if(num#(mid(right(Number, 5), 1, 2)) < 1, chr(32), if(num#(mid(right(Number, 5), 1, 2)) < 21,
applymap('Map_FirstNumbers', num#(mid(right(Number, 5), 1, 2))),
if(num#(mid(right(Number, 5), 1, 2)) < 100, applymap('Map_SecondNumber', num#(mid(right(Number, 5), 1, 1)), chr(32)) & chr(32) &
applymap('Map_FirstNumbers', num#(mid(right(Number, 4), 1, 1)), chr(32)))))), chr(32)) as [4+5 value],
if(LenNumber >= 5, ' thousand ', if(LenNumber = 4 and num#(mid(right(Number, 4), 1, 1)) > 0, ' thousand ', chr(32))) as [4-6 unit],
if(LenNumber = 6, applymap('Map_FirstNumbers', num#(mid(right(Number, 6), 1, 1)), chr(32)), chr(32)) as [6 value],
if(LenNumber >= 6 and num#(mid(right(Number, 6), 1, 1)) > 0, ' hundred ', chr(32)) as [6 unit];
load recno() as Number, len(recno()) as LenNumber Autogenerate 999999;
- Labels:
-
App Development
-
Scripting
Overview
For those of us that work with QlikView distribution service, either the standard version or Publisher then perhaps this model may be of some use in analysis of your tasks.
As a Qlik partner, I developed this to read in the various .xml files
...
Overview
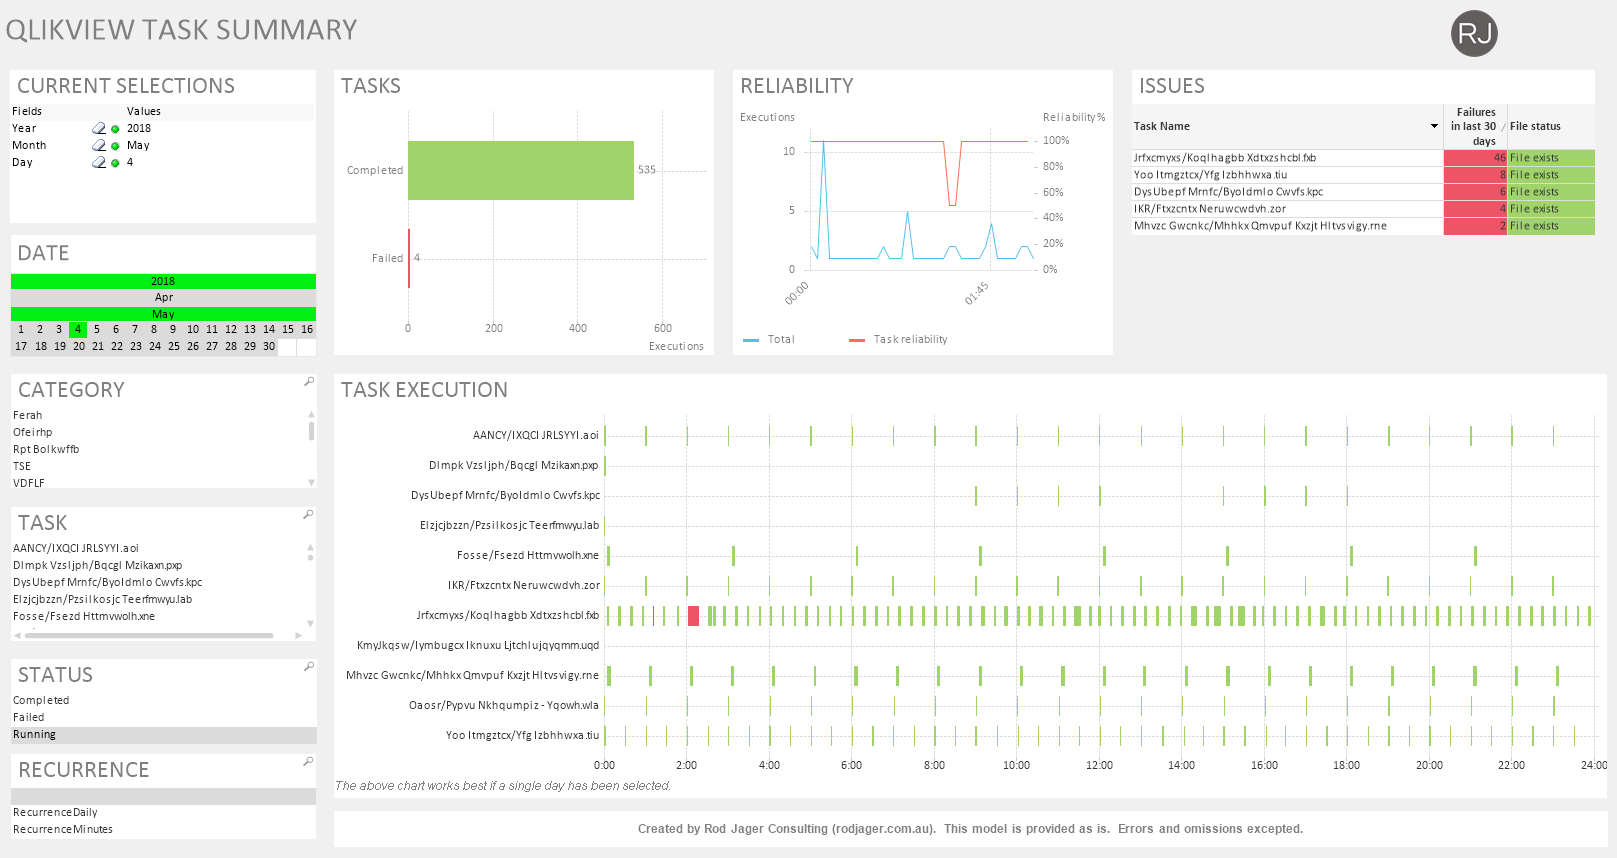
For those of us that work with QlikView distribution service, either the standard version or Publisher then perhaps this model may be of some use in analysis of your tasks.
As a Qlik partner, I developed this to read in the various .xml files created by the distribution service and help look for some common problems such as:
- repetitive failures (TASKS and RELIABILITY - top left and middle charts)
- broken tasks / missing files (ISSUES - top right)
- resource contention (TASK EXECUTION - main chart)
There are lots of clever ways of analysing the QVPR data, including through the Governance dashboard, however I went with this approach as it gave me something tangible and reasonably simple to interpret and then present to a client.
Instructions
- Open the model in QlikView (preferably on the QlikView server)
- Navigate to the Configuration tab
- Update the file locations
- Click the Reload button
- Select the Dashboard tab and start your analysis
Considerations
- Tasks with multiple short reloads may not be easily visible in the gantt chart
- The Gantt chart works best with a single day selected
- Colour conventions are red is bad, green is good and orange is a warning.
I have used in a mix of QlikView 11 and 12 environments using both Publisher and the standard distribution service though I can't account for all environments so the model is provided as is where is, though please feel free to expand for your own use or provide some feedback that may benefit the community.
Thanks for taking the time to read this and I hope you find it useful.
For your reference.
Regards,
Sokkorn
For your reference.
Regards,
Sokkorn
- Labels:
-
App Development
-
Product Documentation
I have two tables Table1,Table2. Table1 has DATE, Table2 has START_DT,END_DT. Want to join these two tables on DATE columns.Intervalmatch function will help us to make the join in Qlik. If we use left join, we can avoid synthetic tables too. Here is
...I have two tables Table1,Table2. Table1 has DATE, Table2 has START_DT,END_DT. Want to join these two tables on DATE columns.Intervalmatch function will help us to make the join in Qlik. If we use left join, we can avoid synthetic tables too. Here is the example.If you want to test, prepare the test data.
Let me know if you need any more info/clarification.
Table1:
LOAD COUNTRY,
DATE,
C1,
C2
FROM Table1;
Table2:
LOAD COUNTRY, C3,C4,
date(START_DT) as START_DT,
date(END_DT) as END_DT
FROM Table2;
Final_Table:
INTERVALMATCH (DATE) left JOIN LOAD START_DT, END_DT RESIDENT Table2;
left Join (Table1) LOAD distinct * RESIDENT Table2;
DROP TABLE Table2;
- Tags:
- qlikview
- Labels:
-
New to QlikView
-
Scripting
-
Security
Hi Qlikers,
All of you might handling the large Fact tables load from QlikView on daily basis. When there is large Fact table, we always prefer to load the table either with Incremental load or we create day wise QVDs instead of loading the entire tab
...Hi Qlikers,
All of you might handling the large Fact tables load from QlikView on daily basis. When there is large Fact table, we always prefer to load the table either with Incremental load or we create day wise QVDs instead of loading the entire table again on daily basis and which is a good practice. 
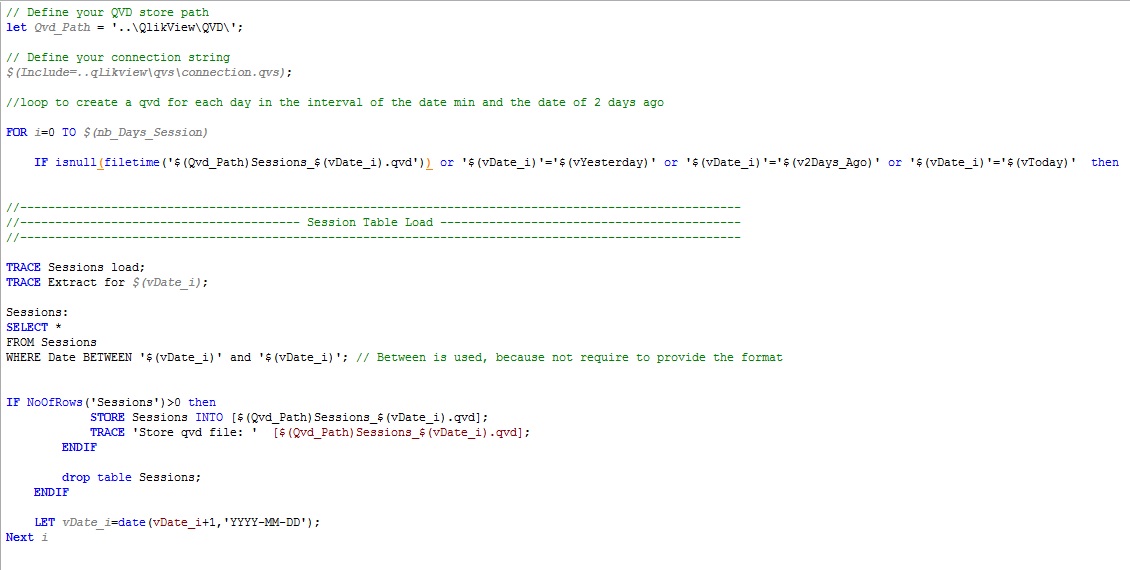
Here, I have a scenario where I have large fact table and I preferred to load the table by creating day wise qvds. I have created the script which will check if QVDs are created or not for particular day. If QVD is created it will not create it again (in for loop) else it will always create the QVDs for Today, Yesterday and 2 Days ago ( with Today I want to create the yesterday and 2 days ago QVD also as there are some modifications could be done for Yesterday or 2 Days ago data ).
After creating all QVDs you can simply load all the QVDs in QlikView by *.qvd.
Just thought of sharing the script which will be helpful to people who are new to QlikView.
Below is the script highlighted
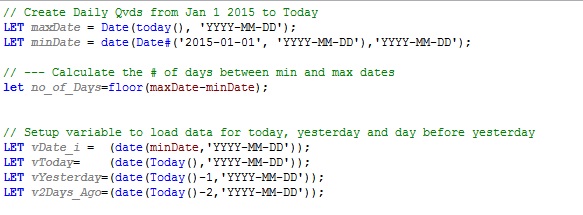
vDate_i is the variable which is used in where condition while we load the data from source database. Here, one thing should be noted that vDate_i variable format should be same as the Date Field in Source database table, so that the where condition will not fail while loading the data from source database table.
Please find the attached qvw file.
- Tags:
- qlikview
- Labels:
-
App Development
An explanation of the following type of QlikView Event Log Errors:
"Restart: Server aborted trying to recover by restart. Reason for restart: Internal inconsistency, type ?, detected."
An explanation of the following type of QlikView Event Log Errors:
"Restart: Server aborted trying to recover by restart. Reason for restart: Internal inconsistency, type ?, detected."
Ejemplos de Función Date# y Date para transformar fechas y luego darles formato. Esto como método alternativo a MakeDate, que usa 4 funciones haciendo más lento el load:
MakeDate(Left(20130628,4), Mid(20130628,5,2),Right(20130628,2))
1. Date#(20130628
...Ejemplos de Función Date# y Date para transformar fechas y luego darles formato. Esto como método alternativo a MakeDate, que usa 4 funciones haciendo más lento el load:
MakeDate(Left(20130628,4), Mid(20130628,5,2),Right(20130628,2))
1. Date#(20130628,'YYYYMMDD')
Devuelve 41453 en formato 20130628
2. Date(Date#(20130628,'YYYYMMDD'),'DD-MMM-YY')
Devuelve 41453 con formato 28-jun-13
3. Date(Date#('2013.06.28','YYYY.MM.DD'),'DD-MMM-YY')
Devuelve 41453 con formato 28-jun-13
4. Date(Date#('06-28-13','MM-DD-YY'),'DD-MMM-YY')
Devuelve 41453 con formato 28-jun-13
5. Date(Date#('28.06.13' ,'DD.MM.YY'),'DD-MMM-YY')
Devuelve 41453 con formato 28-jun-13
6. Date(Date#('jun.28.2011', 'DD.MMM.YYYY'), 'DD-MMM-YY')
Devuelve 41453 con formato 28-jun-13
7. Para eliminar hora de una fecha
Date(Floor( '2013-06-28 07:30:38' ),'DD-MMM-YY')
Devuelve 41453 con formato 28-jun-13 sin minutos
8. Para obtener solo la hora de una fecha
Time(Frac( '2013-06-28 11:30:38' ),'hh:mm:ss')
Devuelve 0,47960648148 con formato 11:30:38
9. Para obtener Fecha y Hora
Date( Timestamp#( '20130628 11:30:38', 'YYYYMMDD hh:mm:ss'), 'DD-MMM-YY hh:mm:ss' )
Devuelve 41453,479606481 con formato 28-jun-13 11:30:38
10. Para obtener día de la semana en fecha
Date( '2013-06-28', 'WWW DD-MMM-YY')
Devuelve 41453 con formato vie 28-jun-13
11. Resta un mes a la fecha
AddMonths('2013-06-28',-1)
Devuelve 41422 en formato 28/05/2013 (formato predeterminado)
12. Suma un mes a la fecha
AddMonths('2013-06-28', 1)
Devuelve 41453 en formato 28/07/2013 (formato predeterminado)
Esta nota esta publicada en el blog: Qlikview en Español
NOTAS:
Al indicar un formato de hora en Qlikview la letra mayuscula M= mes, y letra minuscula m= minutos
Referencias (ingles)
http://community.qlik.com/blogs/qlikviewdesignblog/2013/02/19/why-don-t-my-dates-work
- Labels:
-
Creating Analytics
-
Scripting
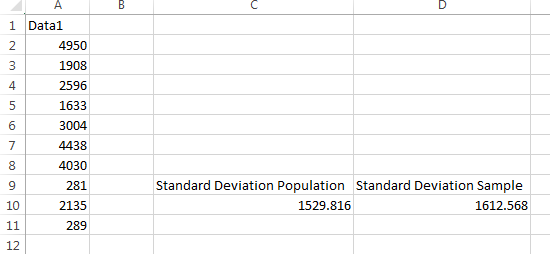
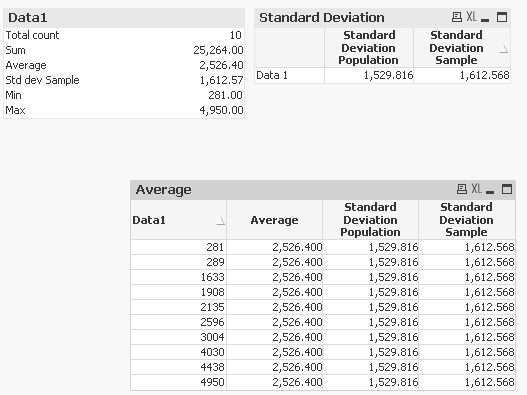
Inspired by swuehl's response here: Help with Standard deviation Full population No... | Qlik Community I thought it make sense to share a way to calculate population standard deviation as QlikView's Stdev() seems to be a sample standard deviation.
...Inspired by swuehl's response here: Help with Standard deviation Full population No... | Qlik Community I thought it make sense to share a way to calculate population standard deviation as QlikView's Stdev() seems to be a sample standard deviation. The difference between the two becomes negligible as the number of data point increases, but there might be a use case to apply population standard deviation for a smaller dataset.
I start with no dimension in an Excel file
If you look at the statestic box, you will see that the standard deviation will show the sample stdev number
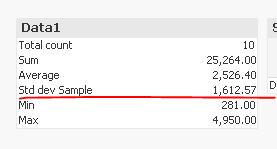
Also, when you use =Stdev(Data1), it will show the same number as above. In order to get population stdev, all you need to do is to multiple the standard deviation with this
=Stdev(Data1) * sqrt((Count(Data1)-1)/Count(Data1))
In other words, I am multiplying the Sample standard deviation with Sqrt((Number of Observations - 1)/Number of observations). So, for the above sample it would be Sqrt(9/10).
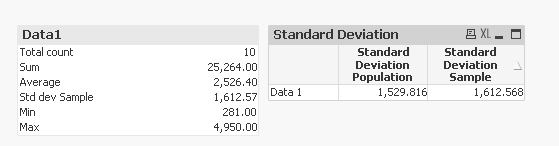
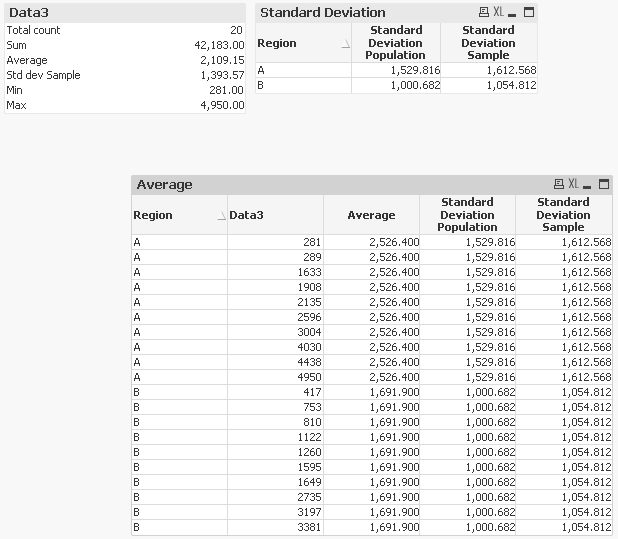
And the same logic can be carry forward to a table to create confidence intervals using TOTAL qualifer
Sample
=Stdev(TOTAL Data1)
Population
=Stdev(TOTAL Data1) * sqrt((Count(TOTAL Data1)-1)/Count(TOTAL Data1))
Same idea can be applied if you want to calculate Sample or Population Standard Deviation by Dimension
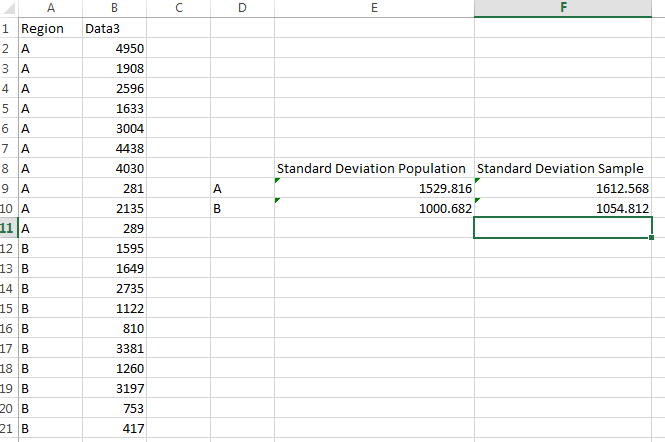
In the a chart, you can use these expressions
Sample
=Stdev(TOTAL <Region> Data3)
Population
=Stdev(TOTAL <Region> Data3) * sqrt((Count(TOTAL <Region> Data3)-1)/Count(TOTAL <Region> Data3))
- Tags:
- qlikview
- stdev
- total_qualifier
- Labels:
-
App Development
-
New to QlikView
Here is an easy approach to extracting the data model from a QlikView (QVW) file. The example documented uses QlikView Desktop, if you are using Qlik Sense then please click here.
Why would you use or need this kind of technique?
In a production enviro
...Here is an easy approach to extracting the data model from a QlikView (QVW) file. The example documented uses QlikView Desktop, if you are using Qlik Sense then please click here.
Why would you use or need this kind of technique?
In a production environment you may find use of the output table script elements without the variables as they can be useful in load processes when transformed QVDs can be re-used by other applications. However, there are many times where you need to create something quickly for an ad-hoc piece of work or as a demonstration to show a customer with amended data to make it more relevant (changing product, department names etc). This approach can also be useful when working offline on the front end or application tuning where you do not want to deal with all of the complications of the ETL process.
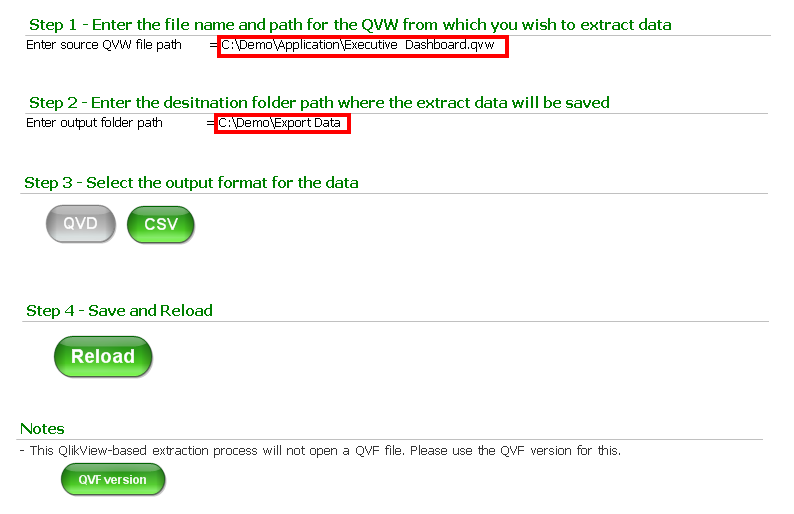
Step 1 - Enter the file name and path for the QVW from which you wish to extract data
- Enter the full file path and name for the QVW
- e.g. C:\Demo\Application\Executive Dashboard.qvw
Step 2 - Enter the destination folder path where the extract data will be saved
- Enter the full folder path for the destination folder
- e.g. C:\Demo\Export Data
Step 3 - Select the output format type
- Your choices are either QVD (Qlik's proprietary file store format) or more generic CSV
Step 4 - Save and reload the application
Please note these instructions are also included in the dashboard itself in case you forget where it came from. This is what the dashboard looks like.
It's as easy as that.
Power Tools 1.2 for QlikView - Readme
Power Tools 1.2 for QlikView - Readme
- Labels:
-
Deployment
-
Developer Toolkit
-
Management
Hi,
The below code helps in replacing characters with ASCII codes in a string in Load script
For example
ABC is converted to 656667- since ASCII code of A is 65, B is 66 and C is 67.
CharMap:
Mapping LOAD
Chr(RecNo() - 1) AS Char,
RecNo() - 1 AS Asciicod
...Hi,
The below code helps in replacing characters with ASCII codes in a string in Load script
For example
ABC is converted to 656667- since ASCII code of A is 65, B is 66 and C is 67.
CharMap:
Mapping LOAD
Chr(RecNo() - 1) AS Char,
RecNo() - 1 AS Asciicode
AutoGenerate 256;
Data:
LOAD
Text,
MapSubString('CharMap', Text) as formattedText
FROM DataSource;
Hope this helps.
Regards,
Jagan.
Hi Guys,
In this article I would like to share my experience with section access. I didn’t find articles in the community with similar solution and I hope it will be helpful for people that meet with complex authorization face to face first time.
Firs
...Hi Guys,
In this article I would like to share my experience with section access. I didn’t find articles in the community with similar solution and I hope it will be helpful for people that meet with complex authorization face to face first time.
First of all in my opinion the most useful articles about complex section access is Basics for complex authorization and Data Reduction Using Multiple Fields written by Henric Cronström.
As we can see in the articles in the simplest case, the authorization table can have only two columns: USER and reducing field (Region, etc.), but usually we have two or three columns for data reducing.
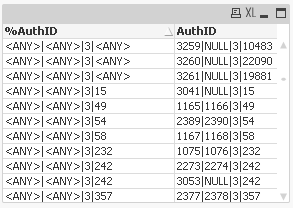
In case of two columns we have four combinations of %AuthID and need make our load four times:
Load Region &'|'& Product as AuthID, Region &'|'& Product as %AuthID From OrderDetails ;
Load Region &'|'& Product as AuthID, Region &'|'&'<ANY>' as %AuthID From OrderDetails ;
Load Region &'|'& Product as AuthID, '<ANY>'&'|'& Product as %AuthID From OrderDetails ;
Load Region &'|'& Product as AuthID, '<ANY>'&'|'&'<ANY>' as %AuthID From OrderDetails ;
In case of three reducing fields, we have eight combinations.
Number of combinations can be calculated by following formula:
C = 2n
because every field can be in two states: <ANY> or Value
In my case I had 8 columns for authorization and 256 combinations, I was upset when understood that I should create 256 tables with different combinations manually to load my Authorization Bridge table correctly. I started looking for a solution, below you can see script that solve the problem. In the example I use only four field because I want show the general idea.
Steps:
1. Create table with one field and two values
Temp:
LOAD * Inline [
Field
Value
<ANY>
];
Create table with Field combinations
TmpCombinations:
LOAD Field AS Field1 Resident Temp;
join LOAD Field AS Field2 Resident Temp;
join LOAD Field AS Field3 Resident Temp;
join LOAD Field AS Field4 Resident Temp;
DROP TABLE Temp;
TmpCombinations table:
Field1 | Field2 | Field3 | Field4 |
<ANY> | <ANY> | <ANY> | <ANY> |
<ANY> | <ANY> | <ANY> | Value |
<ANY> | <ANY> | Value | <ANY> |
<ANY> | <ANY> | Value | Value |
<ANY> | Value | <ANY> | <ANY> |
<ANY> | Value | <ANY> | Value |
<ANY> | Value | Value | <ANY> |
<ANY> | Value | Value | Value |
Value | <ANY> | <ANY> | <ANY> |
Value | <ANY> | <ANY> | Value |
Value | <ANY> | Value | <ANY> |
Value | <ANY> | Value | Value |
Value | Value | <ANY> | <ANY> |
Value | Value | <ANY> | Value |
Value | Value | Value | <ANY> |
Value | Value | Value | Value |
2. Create table with real field names
NoConcatenate
Combinations:
LOAD
if(Field1='Value', '[Region]',chr(39)&Field1&chr(39)) AS Field1,
if(Field2='Value', '[Product]',chr(39)&Field2&chr(39)) AS Field2,
if(Field3='Value', '[SubRegion]' ,chr(39)&Field3&chr(39)) AS Field3,
if(Field4='Value', '[SubProduct]',chr(39)&Field4&chr(39)) AS Field4
Resident TmpCombinations;
DROP TABLE TblCombinations;
Table with real field Names:
Field1 | Field2 | Field3 | Field4 |
'<ANY>' | '<ANY>' | '<ANY>' | '<ANY>' |
'<ANY>' | '<ANY>' | '<ANY>' | [SubProduct] |
'<ANY>' | '<ANY>' | [SubRegion] | '<ANY>' |
'<ANY>' | '<ANY>' | [SubRegion] | [SubProduct] |
'<ANY>' | [Product] | '<ANY>' | '<ANY>' |
'<ANY>' | [Product] | '<ANY>' | [SubProduct] |
'<ANY>' | [Product] | [SubRegion] | '<ANY>' |
'<ANY>' | [Product] | [SubRegion] | [SubProduct] |
[Region] | '<ANY>' | '<ANY>' | '<ANY>' |
[Region] | '<ANY>' | '<ANY>' | [SubProduct] |
[Region] | '<ANY>' | [SubRegion] | '<ANY>' |
[Region] | '<ANY>' | [SubRegion] | [SubProduct] |
[Region] | [Product] | '<ANY>' | '<ANY>' |
[Region] | [Product] | '<ANY>' | [SubProduct] |
[Region] | [Product] | [SubRegion] | '<ANY>' |
[Region] | [Product] | [SubRegion] | [SubProduct] |
3. Calculate number of rows in our table (will use in cycle), after this we will be ready to load our data
Let vRowCount=NoOfRows('Combinations');
4. Load data in the cycle, for this we need create variable for every field
FOR i = 0 to vRowCount -1
vFieldName1 = peek('Field1',$(i),'Combinations');
vFieldName2 = peek('Field2',$(i),'Combinations');
vFieldName3 = peek('Field3',$(i),'Combinations');
vFieldName4 = peek('Field4',$(i),'Combinations');
AuthorizationBridge:
LOAD *
Where Exists (Auth, %AuthID);
LOAD Distinct
AuthID,
$(vFieldName1) & '|' & $(vFieldName2) & '|' & $(vFieldName3) & '|' & $(vFieldName4) as %AuthID,
Resident Orders;
Next i;
DROP Tables Combinations, Orders;
We load all possible combinations and not all are valuable, so we can add condition
Where Exists (Auth, %AuthID);
In the preceding load – it will keep only combinations that we have in the Authorization table.
At the end we have Authorization Bridge table.
Thanks,
Vitalii
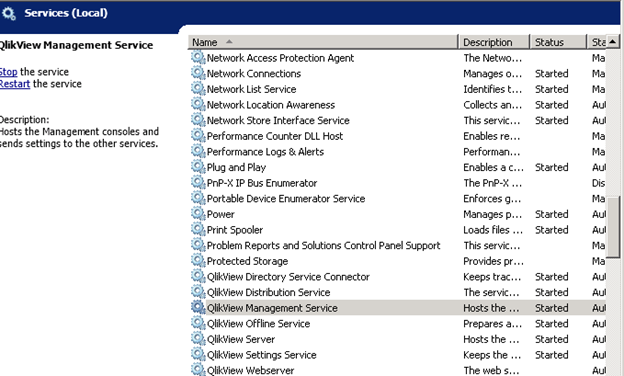
By default Audit Logging is not Enabled – and a QlikView Administrator cannot simply select or deselect the option. So how do you turn Audit Logging on?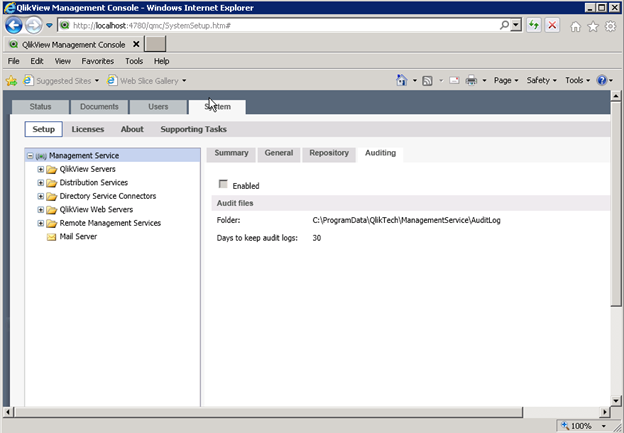
First, you need to stop the QlikView Management Service!
Then edit the QVManagementService.exe.c
...
By default Audit Logging is not Enabled – and a QlikView Administrator cannot simply select or deselect the option. So how do you turn Audit Logging on?
First, you need to stop the QlikView Management Service!
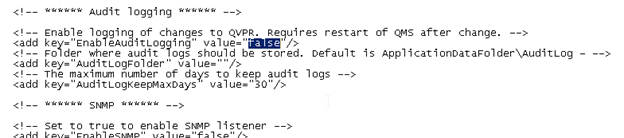
Then edit the QVManagementService.exe.config file using Notepad (you may need to run as an Administrator).

Search for Audit and then change the EnabledAuditLogging from “false” to “true”.
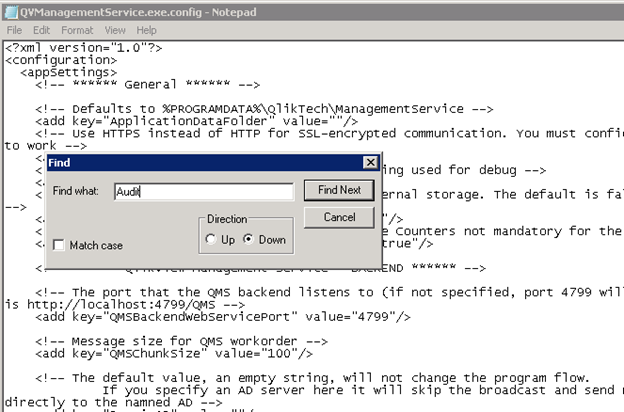
Change the value to True and save the file. Then turn the service back on and check to see if the box is enabled!
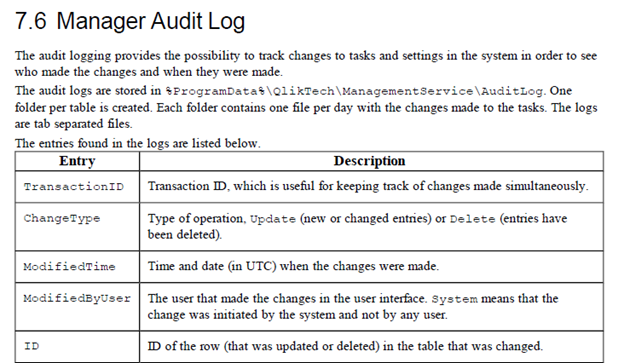
Here is a description of the data collected. The System Monitor 4.1 QlikView application can be used to investigate this dataset.
- Tags:
- qlikview
- qlikview audit
- Labels:
-
Articles
-
Management
-
Security
(MENSAJE EN ESPAÑOL A CONTINUACIÓN)
Last status - 15/07/2018
QVW apps and original files with player predictions attached (RAR file)
---------------------------------------------------------------------
Último estado - 15/07/2018
Se adjuntan las aplicacio
...(MENSAJE EN ESPAÑOL A CONTINUACIÓN)
Last status - 15/07/2018
QVW apps and original files with player predictions attached (RAR file)
---------------------------------------------------------------------
Último estado - 15/07/2018
Se adjuntan las aplicaciones QVW y los ficheros originales con las predicciones de los participantes (fichero RAR).
----------------------------------------------------------------------------------------------------------------------------------------------------
(MENSAJE EN ESPAÑOL A CONTINUACIÓN)
Hi guys,
There are only 52 days left until World Cup 2018 (https://fifa.com/worldcup) starts. Who will be the World Champion? Will the Cup stay in Europe, stay in America or go to a new continent?

If, in addition to Qlik, football (soccer) is one of your passions, take part in this competition of the 2018 World Cup:
- Fill in the attached excel with the results of the group and final phase.
- Rename the excel with the following mask:
- Name and surnames separated by spaces +
- "_" (underline) +
- Your country's name +
- "_" (underline) +
- Your city's name
- "_QC.xlsx"
- For example: Andres Iniesta_Spain_Albacete_QC.xlsx
- Upload it to Dropbox using the following URL: https://www.dropbox.com/request/2JCESrVzg1emWUT4qLfy
Players will win points following these rules:
- Groups phase:
- 3 points per successful result of each match (eg Spain wins Portugal)
1 point per successful score of each match (eg Portugal 1 - 3 Spain)
- Final phase:
- 6 points per successful result of each match (eg Spain wins Uruguay in round of 16) in the whole final phase
- 4 points per successful score of each match (eg Spain 2 - 1 Uruguay in round of 16) in the whole final phase
- 6 points for each successful team that passes to round of 16
- 8 points for each successful team that passes to quarter-finals
- 10 points for each successful team that passes to semi-finals
20 points for guessing the team that remains 4th of the World Cup
- 20 points for guessing the team that remains 3th of the World Cup
- 25 points for guessing the team that remains 2th of the World Cup
- 30 points for guessing the team that wins the World Cup
- NOTE: The scoreboard to be taken into account for the matches of the final phase will be with the end of the game before the extension (in case of a tie)
- The player with the most points at the end of the World Cup will win the competition
It is a free competition (of course) and without any material prize beyond demonstrating knowledge of football and having a good time. A QlikView application will be created in which the course of the competition will be shown (analysis of the participants, ranking, etc.). We can build these applications among all participants and so each one can contribute with their knowledge in: visualizations, scripting, etc.
I encourage you to participate in the competition, have a good time with fellow Community members and continue to learn Qlik, so ... fill in the excel and upload it to Dropbox to participate!
Of course, I will be attentive to any doubts that may arise, requesting improvements and suggestions.
Thank you very much and greetings,
HM
----------------------------------------------------------------------------------------------------------------------------------------------------------------
Hola chic@s,
Solo quedan 52 días para que el Mundial de 2018 (https://es.fifa.com/worldcup) empiece. ¿Quién será el campeón mundial de fútbol? ¿Se quedará en Europa, se quedará en América o irá a un nuevo continente?

Si, además de Qlik, el fútbol es una de tus pasiones, anímate a participar en esta competición del Mundial de 2018:
- Rellena la excel adjunta con los resultados de las fase de grupos y fase final.
- Renombra la excel con la siguiente máscara:
- Nombre y apellidos separado por espacios +
- "_" (subrayado) +
- Nombre de tu país +
- "_" (subrayado) +
- Nombre de tu ciudad +
- "_QC.xlsx"
- Por ejemplo: Andres Iniesta_Spain_Albacete_QC.xlsx
- Súbela a Dropbox mediante la siguiente URL: https://www.dropbox.com/request/2JCESrVzg1emWUT4qLfy
Las puntuaciones serán las siguientes:
- Fase de grupos:
- 3 puntos por resultado acertado de cada partido (p.e. España gana a Portugal)
- 1 punto por marcador acertado de cada partido (p.e. Portugal 1 - 3 España)
- Fase final:
- 6 puntos por resultado acertado de cada partido (p.e. España gana a Uruguay en dieciseisavos) en toda la fase final
- 4 puntos por marcador acertado de cada partido (p.e. España 2 - 1 Uruguay en dieciseisavos) en toda la fase final
- 6 puntos por cada equipo acertado que pasa a octavos de final
- 8 puntos por cada equipo acertado que pasa a cuartos de final
- 10 puntos por cada equipo acertado que pasa a semifinales
- 20 puntos por acertar el equipo que queda 4º del Mundial
- 20 puntos por acertar el equipo que queda 3º del Mundial
- 25 puntos por acertar el equipo que queda 2º del Mundial
- 30 puntos por acertar el equipo que gana el Mundial
- NOTA: El marcador a tener en cuenta para los partidos de fase final será con el que finalice el partido antes de la prórroga (en caso de empate)
- Ganará el jugador que más puntos consiga al final del Mundial
Es un torneo gratuito (por supuesto) y sin ningún premio más allá de demostrar el conocimiento de fútbol y de pasar un buen rato. Se creará una aplicación QlikView en las que se muestre el desarrollo de la competición (análisis de los participantes, ránking, etc.). Estas aplicaciones las podremos construir entre todos y así cada uno podrá aportar su conocimiento en: visualizaciones, scripting, extensiones, etc.
Os animo a participar en la competición, pasar un buen rato con compañeros de la Community y seguir aprendiendo Qlik, así que.. ¡rellena la excel y súbela a Dropbox para participar!
Por supuesto, estaré atento a las dudas que surjan, petición de mejoras y sugerencias.
Muchas gracias y un saludo,
HM
Partial Reload
Loading data into Qlikview, we are having two data load options.
They are,
Full Reload – Load entire data, even, If the file having data also, we will reload the entire data. (File-> Reload)
Partial Reload – The name itself we
Partial Reload
Loading data into Qlikview, we are having two data load options.
They are,
Full Reload – Load entire data, even, If the file having data also, we will reload the entire data. (File-> Reload)
Partial Reload – The name itself we are having the meaning for partial reload. Yes. Loading only partial data instead of load entire data. (File --> Partial Reload)
Use of Partial load
My QVW file having millions of data rows and having many table on it. If I want to run the entire file It will take more time to reload. For avoid time consume, I am going to use Partial reload option.
Please find the attached document that contains Partial reload /Full Reload scenario's and examples.
Share your comments.
Thanks.
This is an expansion on and simplification of the subroutine I posted for from/to date selection. It essentially uses two "AsOf" tables in parallel, one pointing forward in time, the other pointing backwards in time. Or more generically, one pointing
This is an expansion on and simplification of the subroutine I posted for from/to date selection. It essentially uses two "AsOf" tables in parallel, one pointing forward in time, the other pointing backwards in time. Or more generically, one pointing forward through sortable field values, one pointing backward through sortable field values. These then intersect to connect to all values that are within the defined range.
Normally that technique would fall apart with larger numbers of distinct values, as every value in the From AsOf table must connect to every value greater than it, and every value in the To AsOf table must connect to every value less than it. As a result, for N distinct values, you need N*N rows of data. If you have 100 distinct values, that's not really a problem. But if you have 100,000 distinct values, you're looking at 10,000,000,000 rows, which just isn't doable.
The subroutine reduces this dramatically, generating on the order of N log N rows. I'm using it successfully in an application with about 600,000 distinct timestamps, though with some minor tweaks I believe the subroutine could be adapted for any type of sortable values. You tell it the field of interest and names for all of the fields it will generate. It extracts all values of the field of interest, then sorts and numbers those values. It then builds groupings of those values by powers of 10, each with its own key. At the bottom level, 1 = 1, 2 = 2, and so on. Then you have 10 = 1-10 or 10-19, 20 = 11-20 or 20-29, and so on. Then 100 = 1-100 or 100-199, 200 = 101-200 or 200-299, and so on. And so on. The AsOf tables use those keyed groupings to link to logarithmically fewer rows.
600,000 distinct values is still a bit of a challenge, and adding these tables more than doubled the load time and size of my application. So I don't recommend going much higher than that. The subroutine caps out at 999,998 values. This limit is easily raised by orders of magnitude by bumping up the for/next loop limit, but you may not like what happens if you have 50 million distinct values in the field and try to apply this technique.
This isn't necessarily the best technique, and certainly not for every application. You can use from/to variables to trigger a selection in the main field. You can use set analysis. You have options. I just tend to prefer data model solutions. I want my complexity in the script, not in the front end. I like making normal selections rather than using variables or set analysis. And I wanted to prove to myself that it was possible to handle even a difficult case like this with the data model, and that it could be done in a generic way rather than in the very date-specific way of my previous subroutine.
For my application, I generated a from date, from time, to date, and to time, requiring the tables ending in "3". These aren't strictly needed, but I think it's a lot easier to select a date, then select a time, than to try to scroll a list of 600,000 timestamps. And while it isn't in the subroutine, my application then generated calendars with date, month, and year to connect to each to make the selection of the range even easier. Many people might prefer to use calendar objects on the date fields rather than creating calendar tables. Plenty of options. To turn this into a date-range subroutine, remove the tables ending in "3" and the associated parameters.
I'm still on QlikView 11, and tuned the script performance for that, so I can't speak to the performance in QlikView 12. Hopefully it's the same or better. Hopefully it's bug free, particularly since I have it in a live application, but if bugs are pointed out to me, I'll correct them.
This is the subroutine. I find it easier to read in the attached example file since it's colored properly there.
SUB CreateFromToLinkage(TS,FTS,TTS,FD,TD,FT,TT,FK,TK)
    TS: LOAD timestamp(fieldvalue('$(TS)',recno())) as [$(TS)] AUTOGENERATE fieldvaluecount('$(TS)');
    ID: LOAD [$(TS)],rowno() as ID RESIDENT TS ORDER BY [$(TS)];
    FOR I = 0 TO 5
        LET P = pow(10,I);
        [$(FTS) 1]: LOAD floor(ID,$(P)) as [$(FK)],[$(TS)] RESIDENT ID WHERE mod(floor(ID/$(P)),10) > 0;
        [$(TTS) 1]: LOAD  ceil(ID,$(P)) as [$(TK)],[$(TS)] RESIDENT ID WHERE mod( ceil(ID/$(P)),10) > 0
                     and  ceil(ID,$(P))                     <= fieldvaluecount('$(TS)');
        [$(FTS) 2]: LOAD floor(ID-1,$(P))+   iterno() *$(P) as [$(FK)],[$(TS)] as [$(FTS)] RESIDENT ID WHILE iterno() <= 9 - mod(floor((ID-1)/$(P)),10)
                     and floor(ID-1,$(P))+   iterno() *$(P) <= fieldvaluecount('$(TS)');
        [$(TTS) 2]: LOAD floor(ID  ,$(P))+(1-iterno())*$(P) as [$(TK)],[$(TS)] as [$(TTS)] RESIDENT ID WHILE iterno() <=     mod(floor( ID   /$(P)),10);
    NEXT
    [$(FTS) 3]: LOAD [$(TS)] as [$(FTS)],date(floor([$(TS)])) as [$(FD)],time(frac([$(TS)])) as [$(FT)] RESIDENT TS;
    [$(TTS) 3]: LOAD [$(TS)] as [$(TTS)],date(floor([$(TS)])) as [$(TD)],time(frac([$(TS)])) as [$(TT)] RESIDENT TS;
    DROP TABLES TS,ID;
END SUB
Here are a couple of pictures from the attached example file to help show what's going on:


- Tags:
- qlikview
- Labels:
-
calendar
-
Date Range
-
Scripting
-
timestamp range