Unlock a world of possibilities! Login now and discover the exclusive benefits awaiting you.

Product Innovation
By reading the Product Innovation blog, you will learn about what's new across all of the products in our growing Qlik product portfolio.
Support Updates
The Support Updates blog delivers important and useful Qlik Support information about end-of-product support, new service releases, and general support topics.
Qlik Academic Program
This blog was created for professors and students using Qlik within academia.
Community News
Hear it from your Community Managers! The Community News blog provides updates about the Qlik Community Platform and other news and important announcements.
Qlik Digest
The Qlik Digest is your essential monthly low-down of the need-to-know product updates, events, and resources from Qlik.
Qlik Learning
The Qlik Learning blog offers information about the latest updates to our courses and programs, as well as insights from the Qlik Learning team.
Recent Blog Posts
-
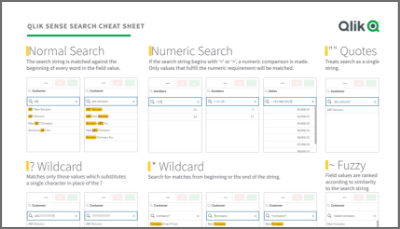
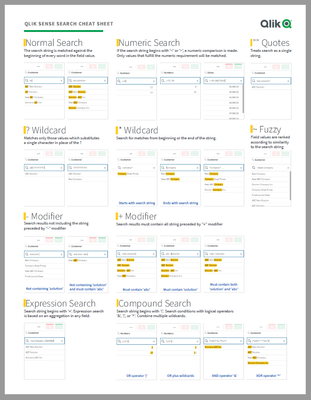
Qlik Sense Cheat Sheet version 2.0
It was back in 2015 when I first published the original Qlik Sense Search Cheat Sheet. Since then, and thanks to lots of individual contributors here in the Community, the Search Cheat Sheet has suffered several transformations to make it more complete and truthful.@afurtado wrote me an email a few weeks ago because he was interested in getting the document localized for the Brazilian folks out there. In addition to thank him for his contribution... Show MoreIt was back in 2015 when I first published the original Qlik Sense Search Cheat Sheet. Since then, and thanks to lots of individual contributors here in the Community, the Search Cheat Sheet has suffered several transformations to make it more complete and truthful.
@afurtado wrote me an email a few weeks ago because he was interested in getting the document localized for the Brazilian folks out there. In addition to thank him for his contribution and sending him the file I decided that it was about the time to get the Search Cheat Sheet an update.
Today I want to introduce a new version of the document. I added the compound search section to it (@jayanttibhe thanks for the tip), and I redesigned and rationalized the position of each element for better comprehension.
As an extra, I made the document multilanguage ready. So, if someone wants to translate the Cheat Sheet to other language (currently available in English, Spanish and Portuguese) please let me know in the comments section and I'll gladly tell you how to help us.
Hope you like it, and please share it.
Arturo
Updates:
Feb 28: French version thanks to @arychener
Feb 25: Italian added thanks to @AntonioCostantino . Russian translation updated
Feb 13, 2020: Cheat sheet includes now the ^ Wildcard to be consistent with Qlik Help. Russian language added thanks to the contribution of @martynova
Jan 29, 2020: German language added thanks to the contribution of @g_mitschke

-
Action required: Snowflake authentication migration guide for Qlik Analytics fol...
Snowflake is rolling out stronger authentication requirements as part of their platform security initiative. Starting May 2026, new connections using only username and password will no longer be accepted, and all existing password-only connections will stop working between August and October 2026. For the full rollout schedule, see Snowflake's authentication enforcement timeline. If your Qlik Sense Cloud Analytics, Qlik Sense Enterprise on Window... Show MoreSnowflake is rolling out stronger authentication requirements as part of their platform security initiative. Starting May 2026, new connections using only username and password will no longer be accepted, and all existing password-only connections will stop working between August and October 2026.
For the full rollout schedule, see Snowflake's authentication enforcement timeline.
If your Qlik Sense Cloud Analytics, Qlik Sense Enterprise on Windows, or QlikView environment connects to Snowflake, you will need to update those connections to use either key-pair authentication or OAuth before this change takes effect.
Who does this apply to?
This applies to any Qlik Cloud Analytics, Qlik Sense Enterprise on Windows, and QlikView connection to Snowflake, where the authentication method is set to Username and Password only. Connections that already use key-pair authentication or OAuth do not need to change.
To check your connections, review the Data connections and look for any Snowflake connections using username and password authentication.
What are my migration options?
There are two supported authentication methods you can migrate to.
Key-Pair Authentication
Key-pair authentication uses an RSA private/public key pair assigned to the Snowflake user account. It is the most straightforward migration path and does not require an identity provider. This option is recommended for most customers.
For setup steps, see Snowflake key-pair authentication documentation and the Qlik Snowflake connector guide.
OAuth
OAuth integrates with your existing identity provider (such as Okta or Azure AD) and is well-suited for organisations that want centralised access control and token-based authentication. It requires an OAuth security integration to be configured in Snowflake.
See the Qlik Snowflake connector guide and Snowflake OAuth documentation.
OAuth support for Snowflake was introduced to Qlik Sense Enterprise on Windows with our May 2026 release.
If you have any questions, we are, as always, happy to assist. Reply to this blog post or take your queries to our Support Chat.
Thank you for choosing Qlik,
Qlik Support -
【オンデマンド配信】データ連携が導く公共サービス改善のヒント
気候変動による災害の激甚化、人口減少による担い手不足、インフラ老朽化、サイバーリスクの高まりなど、行政を取り巻く環境はこれまでにないスピードで変化しています。こうした複合的な社会課題に対し、行政担当者には、限られた人員で迅速かつ的確な対応が求められています。本 Web セミナーでは、サンフランシスコ交通局(SFMTA)、フランスのスマート水道(m2ocity / 現 Veolia)、フランス国家安全保障省の危機管理といった海外の事例を取り上げ、分断されたデータをつなぐことで、どのように業務効率化やサービスの質向上を実現したのかを解説します。日本の行政 DX に役立つヒントをお届けします。 ※ パソコン・タブレット・スマートフォンで、どこからでもご視聴いただけます。今すぐ視聴する 今すぐ視聴する -
Financial Analysis
As a follow-up to my previous blog post titled Finance Report with Waterfall Chart, I wanted to share an awesome demo that showcases financial reporting visualizations including a profit & loss statement with a waterfall chart. Qlik's Dennis Jaskowiak and Ekaterina Kovalenko, and partner Dawid Marciniak from HighCoordination, created the Financial Analysis demo based off of Jedox data, incorporating many enhancements to the straight table and piv... Show MoreAs a follow-up to my previous blog post titled Finance Report with Waterfall Chart, I wanted to share an awesome demo that showcases financial reporting visualizations including a profit & loss statement with a waterfall chart. Qlik's Dennis Jaskowiak and Ekaterina Kovalenko, and partner Dawid Marciniak from HighCoordination, created the Financial Analysis demo based off of Jedox data, incorporating many enhancements to the straight table and pivot table. In addition to the waterfall chart, they use inline SVG to create lollipop charts and bar charts in financial statements.
Here is a look at some of the sheets:
The Dashboard provides a high-level overview of profit and loss, cash flow and liquidity. On this sheet, view the use of inline SVG bar charts and lollipop charts.
The P&L sheet provides a more detailed look at profit and loss.
The Cost Center sheet uses the pivot table to show sales costs.
Find a detailed look of cash flow on the Cash Flow sheet.
This is just some of the sheets you will find in the Financial Analysis demo. If you are looking for appealing ways to visual your financial data while keeping it concise and clean, download the Financial Analysis demo (QVF) here.
Thanks,
Jennell
-
Why Summer Is the Best Time to Learn Analytics and AI
For students looking to stand out in today’s competitive job market, summer offers more than just a break from classes — it’s one of the best opportunities to build valuable skills in analytics and AI. As industries across the globe rapidly adopt data-driven decision-making and artificial intelligence, employers are increasingly looking for candidates who can work with data, uncover insights, and understand modern AI-powered technologies. The goo... Show MoreFor students looking to stand out in today’s competitive job market, summer offers more than just a break from classes — it’s one of the best opportunities to build valuable skills in analytics and AI. As industries across the globe rapidly adopt data-driven decision-making and artificial intelligence, employers are increasingly looking for candidates who can work with data, uncover insights, and understand modern AI-powered technologies. The good news? Students don’t need to wait until graduation to start developing these skills.Summer creates the perfect environment to explore analytics and AI in a flexible, low-pressure way that can have a lasting impact on future careers. -
Qlik Talend Cloud Migration Toolkit (QTCMT)
Migrating a Talend Studio project to the cloud is no small undertaking, but we are here to help. Brought to you by Savraj Rakkar, Benoit Barranco, and Sébastien Leduc. The Qlik Talend Cloud Migration Toolkit (QTCMT) is a structured migration solution built for teams running Talend on-premises who are looking to move to Qlik Talend Cloud and upgrade their project code to Talend 8. Whether the destination is the cloud or an on-premises environment,... Show MoreMigrating a Talend Studio project to the cloud is no small undertaking, but we are here to help.
Brought to you by Savraj Rakkar, Benoit Barranco, and Sébastien Leduc.
The Qlik Talend Cloud Migration Toolkit (QTCMT) is a structured migration solution built for teams running Talend on-premises who are looking to move to Qlik Talend Cloud and upgrade their project code to Talend 8. Whether the destination is the cloud or an on-premises environment, the Qlik Talend Cloud Migration Toolkit provides a clear, automated path to get there.
The Qlik Talend Cloud Migration Toolkit also extends beyond Talend Administration Center (TAC), offering an inventory view of Qlik Enterprise Manager (QEM) and Stitch environments so teams can see their full data integration footprint in one place.
The Core Capabilities
Talend Administration Center
- Register a Talend Administration Center server and browse the complete asset inventory
- Generate assessment reports to understand the migration scope before committing to any changes
- Migrate administrative assets (users, groups, projects, authorizations) and runtime assets (tasks, triggers, plans), including artifact uploads to Nexus 3 or JFrog Artifactory, CVE report generation, and Talend 8 code upgrades
- Automate on-premises upgrades to Talend 8 without a cloud migration
- Run project quality checks to surface best-practice violations and a broad range of code issues, with exportable reports
Qlik Enterprise Manager and Stitch
- View Enterprise Manager and Stitch inventories directly within QTCMT to understand the broader environment before migrating a single asset
Why use the Qlik Talend Cloud Migration Toolkit?
- Automated, phased workflows reduce migration effort significantly, cutting weeks or months off a manual migration timeline in many cases
- Full visibility into Talend Administration Center, Qlik Enterprise Manager, and Stitch environments is available before any assets are touched
- Asset configurations, parameters, authorizations, and project code are preserved throughout the migration process
- The phased approach allows assets to be migrated in stages, reducing risk to production environments and giving teams control over the pace
- Teams not yet ready to migrate can still use Qlik Talend Cloud Migration Toolkit to assess their current environment and plan ahead using the assessment and project quality tools
Why Move to Qlik Talend Cloud?
Moving to Qlik Talend Cloud means less time managing servers, upgrades, and infrastructure, and more time focused on actual work. New features ship monthly, so the platform improves continuously without any effort from the team. Data stays current across connected systems in real time, and the platform scales as needs grow. Teams also benefit from unlimited users and execution engines, backed by a generous initial capacity band.
Getting Started
The best first step is installing the Qlik Talend Cloud Migration Toolkit through the Qlik Help Migration Center and connecting it to an existing Talend Administration Center, Qlik Enterprise Manager, or Stitch environment to get an immediate picture of what is there. Full installation steps are available in the Qlik Talend Cloud Migration Toolkit documentation.
If you have any questions, we're happy to assist. Reply to this blog post or take your queries to our Support Chat.
Thank you for choosing Qlik,
Qlik Support -
Developing Word and PowerPoint reports with the expanded Microsoft O365 Add-in f...
Qlik's O365 Add-in offering for report developers has expanded with two new add-ins to enable Word document and PowerPoint presentation analytic reports. Report developers can now: Compose document or portrait style reports with data from a Qlik Sense app with an output format of .docx or .PDF (using the new Microsoft O365 Add-in for Word). Create PowerPoint presentation analytic reports from a Qlik Sense app with an output of .pptx or .PDF (usi... Show MoreQlik's O365 Add-in offering for report developers has expanded with two new add-ins to enable Word document and PowerPoint presentation analytic reports.
Report developers can now:
- Compose document or portrait style reports with data from a Qlik Sense app with an output format of .docx or .PDF (using the new Microsoft O365 Add-in for Word).
- Create PowerPoint presentation analytic reports from a Qlik Sense app with an output of .pptx or .PDF (using the new Microsoft O365 Add-in for PowerPoint).
How do I get started?
Qlik add-ins for Microsoft Office are installed using a manifest file. If you are using an existing manifest, you will need to download and deploy an updated file to access the new add-ins. See the deployment guide Deploying and installing Qlik add-ins for Microsoft Office.
The manifest covers all three productivity tool Add-ins. They cannot be deployed individually.
Notes on the PowerPoint add-in use
Qlik’s integration testing of Microsoft PowerPoint APIs shows that the O365 Add-in for PowerPoint can be unstable or slow at times. Our investigation with Microsoft reveals this to be a known challenge; some APIs on web vs desktop can result in different behaviors.
If your report developers have difficulty with the online PowerPoint Add-in, contact Qlik Support to open a case with us.
While we investigate the integration with Microsoft to determine if a solution is possible, consider developing your reports with the desktop version of PowerPoint.
For Qlik NPrinting Customers
-
Qlik NPrinting May 2026 Initial Release added support for exporting compatible Word and PowerPoint report templates in QDOCX and QPPTX formats for import into Qlik Cloud Reporting.
Please note that only single-connection templates can be exported.
See the Release Notes for details.
- Please note that due to Microsoft API limitations, it is not possible to embed data into an Excel table within the PowerPoint template to then produce native PowerPoint visualizations in the report. Refer to the help documentation for any other Word and PowerPoint report authoring limitations. See Qlik Reporting Service specifications and limitations for details.
If you have any questions, we're happy to assist. Reply to this blog post or take your queries to our Support Chat.
Thank you for choosing Qlik,
Qlik Support -
Qlik Sense May 2026 (Client-Managed) now available!
Smarter Data, More Flexible Analytics, Better User Experiences We’re excited to introduce the May 2026 release of Qlik Sense Enterprise on Windows (client-managed). This release delivers meaningful enhancements across data scripting, visualization flexibility, and user experience helping your teams move faster from data to insight while improving performance, governance, and usability. Below is a breakdown of what’s new, why it matters, and how y... Show MoreSmarter Data, More Flexible Analytics, Better User Experiences
We’re excited to introduce the May 2026 release of Qlik Sense Enterprise on Windows (client-managed). This release delivers meaningful enhancements across data scripting, visualization flexibility, and user experience helping your teams move faster from data to insight while improving performance, governance, and usability.
Below is a breakdown of what’s new, why it matters, and how your teams can benefit.
-
Table Recipe
A table recipe is an easy, no-code way to prepare a data set for an app, data flow, script or ML experiment. It is a great way for new users to prepare their data and get started building an app without having to write the script to transform the data. It can also be used by experienced users for quick data prep. Table recipe is available in Qlik Cloud Analytics from the Analytics activity center > Prepare data. You can also access it from the + ... Show MoreA table recipe is an easy, no-code way to prepare a data set for an app, data flow, script or ML experiment. It is a great way for new users to prepare their data and get started building an app without having to write the script to transform the data. It can also be used by experienced users for quick data prep. Table recipe is available in Qlik Cloud Analytics from the Analytics activity center > Prepare data. You can also access it from the + Create menu option or + Create New button in the catalog. To begin using it, open table recipe, give it a name and select the space you would like to create it in. Once that is done, you will be prompted to select the data set. Note - the table recipe processes one data set at a time.
Once a data file is selected, you can view the fields to confirm it is the correct data set and then you can load it into table recipe. Once it is loaded, you will see a pop up indicating the number of rows and columns in the dataset. Note that all the rows may not be loaded into the table recipe editor, but the recipe will be applied to the entire data set when it is run. Below is a look at the table recipe. On the left is the functions panel that includes several functions that can be used to prepare the data. Functions are grouped as general, columns, strings, dates, numbers and math. On the right is where the steps in our recipe will be added.
Let’s begin with a simple step like deleting a column. I have a Fax column that I do not need so to delete the column; I can click on the column menu (three vertical dots) and select Delete column.
The step will appear on the right in the table recipe, and I can click Apply to remove the Fax column.
Next, let’s split a column into two new columns. I have a Contact Name field with the contact’s full name. I would like to split the name into two fields – one for first name and one for last name. To do this, I will select the Split column function from the list of string functions on the left. Then I can update the details and apply the step. I will change the separator to a space since that is what separates the first and last name in the ContactName column.
Once I apply that step, I can see the two new fields it generated.
I will open the column menu and select Rename column to change the names of the new columns. Once I apply those steps, the columns and the recipe look like the image below. Keep in mind that the table recipe has steps that flow in a specific order. If those steps were to change, you may not get the expected results. For example, if I moved the rename column step above the split column step it would not work because the column I am renaming does not exist yet.
It is also easy to reorder the columns with the table recipe. The Reorder column function is found in the function group named Columns. Simply, select the column you would like to move and click on the Reorder column function. To move the Address column to the left of the City column, I will select the City column from the Anchor column drop down and then click Apply.
We are also able to apply filters to the data if we want to focus on specific rows. In this example, Country has two different values for the United States – USA and US. I would like to change the US values to USA.
After applying the filter, I can see that I have 6 rows with US as the Country. I can use the string Search and replace function to replace US with USA.
This step included my filter, so it only applied it to the rows I have filtered on.
Let’s perform one more step that I use all the time when loading data. We will extract date parts from the OrderDate field. This will allow us to create other date fields such as month and year fields. If I select the OrderDate field and then select the date function Extract date parts, I am presented with all the possible date part fields I can add as a column to my data set. I simply can toggle on any new fields I would like to add.
Once this step is applied, I can see the 4 new date fields I added.
When all the steps have been added to the table recipe, the next steps are to set the target and run the recipe. Setting the target is nothing more than giving the target file a name and file type (qvd, parquet, txt or csv) and selecting the space to create it in.
What is nice about the table recipe is the steps are applied and stored in a new file, separate from the original data set, so you do not have to worry about incorrectly modifying the data set. Once the target is set, the Incomplete recipe message at the top of the page will change to Valid recipe and the Run recipe button will be enabled. Once the recipe is run, you can view your new data set and use it accordingly. The target data set will be stored in the desired space and can be accessed anytime via the catalog.
Notice how all these steps we are creating are very easy and intuitive to build. You do not have to be an expert to perform these steps, and the editor is very user friendly and has a clean flow. What is also nice is that you can see that each step is working as expected when you apply it. Take this product tour to get a feel for the table recipe and then try it for yourself. To learn more, check out Qlik Help.
Thanks,
Jennell
-
Level Up Your Qlik Experience: Community Resource Spotlight
Hey guys join @Jennell_Yorkman and I for a quick community resource update as we highlight some of the latest ideas, enhancements, and best practices being shared across the Qlik Design Blog and Qlik Community. From dashboard design and developer capabilities to visualization techniques and platform improvements, this session is a fast-paced roundup of useful content and community-driven insights to help you get more out of Qlik. Whether you’re b... Show MoreHey guys join @Jennell_Yorkman and I for a quick community resource update as we highlight some of the latest ideas, enhancements, and best practices being shared across the Qlik Design Blog and Qlik Community.
From dashboard design and developer capabilities to visualization techniques and platform improvements, this session is a fast-paced roundup of useful content and community-driven insights to help you get more out of Qlik. Whether you’re building apps, designing dashboards, or exploring new capabilities, this is a great way to stay connected with what’s happening across the Qlik ecosystem.

-
QlikView server communication interruptions following Microsoft Windows Domain C...
Edited May 4th, 2026: Added mitigation article, published on the 4th of May. Beginning on April 14, 2026, multiple QlikView customers experienced outages and intermittent disruptions within their QlikView environments. These incidents coincided with the deployment of Microsoft’s April 2026 security patches to Domain Controllers, which affected QlikView Server Service (QVS) communications over port 4747. The Microsoft patches introduced changes ta... Show MoreEdited May 4th, 2026: Added mitigation article, published on the 4th of May.
Beginning on April 14, 2026, multiple QlikView customers experienced outages and intermittent disruptions within their QlikView environments. These incidents coincided with the deployment of Microsoft’s April 2026 security patches to Domain Controllers, which affected QlikView Server Service (QVS) communications over port 4747.
The Microsoft patches introduced changes targeting Kerberos authentication and RC4 encryption. See Addendum for a list of patches. As a result, QlikView environments where RC4 remained enabled (such as at the domain account or Windows server level) became unstable or non-functional.
The impact on QlikView may include, but is not limited to:
- Failed QlikView Distribution Server distribution tasks with an error code indicating an Authentication Failure.
- "No Server" message on the QlikView AccessPoint with an error message in the Web server log indicating that the Web server cannot connect to the QlikView Server.
- Failed Qlik NPrinting distributions to QlikView using a QVP Connection.
- Problems accessing the QlikView Server settings from the QlikView Management Console, or failures for the QlikView Server to come online after a restart.
What can be done to mitigate this issue?
We've published an article to help address the issue. See QlikView server communication interruptions following Microsoft Windows RC4 cipher suite deprecation.
Information in the article is based on Microsoft's remediation steps and has been adjusted and expanded to include QlikView-specific instructions. For the original, see Detect and remediate RC4 usage in Kerberos | learn.microfot.com.
What action is Qlik taking?
RC4 support was deprecated starting with the May 2024 release of QlikView. The root cause in these cases stems from legacy configurations where RC4 remained enabled in the environment, rather than a defect in QlikView itself. No code changes are planned at this time, though improvements to diagnostic logging are under consideration.
Addendum
Microsoft Patches:
- Windows Server 2022 (DC): KB5082142
- Windows Server 2019 (DC): KB5082123
- Windows Server 2016 (DC): KB508208
If you have any questions, we're happy to assist. Reply to this blog post or take your queries to our Support Chat.
Thank you for choosing Qlik,
Qlik Support -
Introducing enhanced subscription options for the Qlik Cloud Status Page (per re...
Hello Qlik Cloud users and admins, We’ve enhanced the Qlik Cloud Status page subscription experience to give you more control over the notifications you receive. Previously, subscribing meant you received incident and maintenance notifications for all Qlik Cloud regions. With the updated Statuspage experience, you can now choose specific Qlik Cloud regions you want to follow. This helps reduce unnecessary notifications in your inbox and puts the ... Show MoreHello Qlik Cloud users and admins,
We’ve enhanced the Qlik Cloud Status page subscription experience to give you more control over the notifications you receive.
Previously, subscribing meant you received incident and maintenance notifications for all Qlik Cloud regions. With the updated Statuspage experience, you can now choose specific Qlik Cloud regions you want to follow.
This helps reduce unnecessary notifications in your inbox and puts the focus on the Qlik Cloud deployment regions you have active tenants in.
How do I subscribe or modify my current subscription?
To subscribe:
- Visit status.qlikcloud.com
- Click Log In in the top right of the page and authenticate with your Qlik ID
- Click Subscribe to Updates
- Select your preferred notification method (Email or RSS feed)
- Confirm the method
- Choose which deployment region you wish to be notified for
- Click Save
To update your preferences:
- Visit status.qlikcloud.com
- Click Log In in the top right of the page and authenticate with your Qlik ID
- Click Subscribe to Updates
- Select your preferred notification method (Email)
- Enter the email address associated with your subscription and click Subscribe via Email; this will send a One-Time Passcode (OTP) to your registered email address and may prompt a CAPTCHA
- Complete the CAPTCHA (if applicable) and click Subscribe to Update
- Retrieve the One-Time Passcode (OTP), then enter your email address and your OTP
- Click Verify OTP and Subscribe, and complete the CAPTCHA
- Select or deselect the Qlik Cloud regions you want to follow
- Save your updated preferences
For a full guide, see Qlik Cloud and Qlik Talend Cloud Status.
Thank you for choosing Qlik,
Qlik Support -
Techspert Talks - Monitoring Qlik Cloud Capacity
Hi everyone, Want to stay a step ahead of important Qlik support issues? Then sign up for our monthly webinar series where you can get first-hand insights from Qlik experts. The Techspert Talks session from May looked at Monitoring Qlik Cloud Capacity. But wait, what is it exactly?Techspert Talks is a free webinar held on a monthly basis, where you can hear directly from Qlik Techsperts on topics that are relevant to Customers and Partners tod... Show MoreHi everyone,
Want to stay a step ahead of important Qlik support issues? Then sign up for our monthly webinar series where you can get first-hand insights from Qlik experts.The Techspert Talks session from May looked at Monitoring Qlik Cloud Capacity.
But wait, what is it exactly?
Techspert Talks is a free webinar held on a monthly basis, where you can hear directly from Qlik Techsperts on topics that are relevant to Customers and Partners today.In this session we will cover:
- Understanding capacity usage
- Explore the reporting app
- Tips for managing consumption

-
Qlik Automate: Execution tokens will become header parameters at the end of June...
Edit 24th of June 2026: Extended time from February to June. Hello Qlik Users, As announced previously (see Qlik Automate execution token changes), execution tokens will become header parameters at the end of June 2026 (previously February 1st). When triggering an automation via the trigger URL (see the endpoint below), the execution token must be sent as a header parameter. Currently, it is possible to send the execution token as a query paramet... Show MoreEdit 24th of June 2026: Extended time from February to June.
Hello Qlik Users,
As announced previously (see Qlik Automate execution token changes), execution tokens will become header parameters at the end of June 2026 (previously February 1st).
When triggering an automation via the trigger URL (see the endpoint below), the execution token must be sent as a header parameter. Currently, it is possible to send the execution token as a query parameter. Starting at the end of June 2026, sending execution tokens as header parameters will be enforced.
api/v1/automations/{id}/actions/executeAny Button objects using the built-in Run Automation feature are not affected by this change.
Don't hesitate to reach out if you have any questions, or address our experts directly in the Qlik Automate forum.
Thank you for choosing Qlik,
Qlik Support -
【BookLive / Gakken / 日清食品のユーザー事例講演が決定!】AI Reality Tour Tokyo 2026
6/10 (水)開催 AI Reality Tour Tokyo 2026BookLive / Gakken / 日清食品のユーザー事例講演が決定! 来たる 6/10(水)、「AI Reality Tour Tokyo 2026」を開催いたします。 本イベントでは、Qlik のエキスパートによる基調講演、Qlik ユーザーの先進的な事例、Qlik 技術部門による最新の製品情報、Qlik のパートナー企業による最新のソリューションや展示ブースなど、AI がもたらす価値と現実とのギャップを解消し、AI を実現・加速・適応する最先端のソリューションをご紹介します。 詳しい講演概要・お申し込みはこちら Qlik の AI ビジョンと戦略 - 企業全体の AI 活用を成功に導く実践的な手法 最新のエージェンティック - 今すぐ活用できる最新のイノベーションが切り拓く新たな可能性 先進的な顧客事例 - Qlik を活用してビジネス変革を実現している企業の事例 新たなつながり - 新たな知見... Show More6/10 (水)開催 AI Reality Tour Tokyo 2026
BookLive / Gakken / 日清食品のユーザー事例講演が決定!来たる 6/10(水)、「AI Reality Tour Tokyo 2026」を開催いたします。
本イベントでは、Qlik のエキスパートによる基調講演、Qlik ユーザーの先進的な事例、Qlik 技術部門による最新の製品情報、Qlik のパートナー企業による最新のソリューションや展示ブースなど、AI がもたらす価値と現実とのギャップを解消し、AI を実現・加速・適応する最先端のソリューションをご紹介します。
- Qlik の AI ビジョンと戦略 - 企業全体の AI 活用を成功に導く実践的な手法
- 最新のエージェンティック - 今すぐ活用できる最新のイノベーションが切り拓く新たな可能性
- 先進的な顧客事例 - Qlik を活用してビジネス変革を実現している企業の事例
- 新たなつながり - 新たな知見をもたらす Qlik のエキスパートや同業他社との交流
お申し込みの締め切りは、6月 2日(火)17:00 までです。お早めにお申し込みください。【開催概要】
日時:2026年 6月 10日(水)13:00 - 18:30(受付開始 12:00)
懇親会 18:30 - 19:30
会場:有明セントラルタワーホール&カンファレンス
東京都江東区有明3-7-18 有明セントラルタワー3F・4F参加費:無料
お問い合わせ:Marketingjp@qlik.com までお問い合わせください。 -
Decomposition Tree with AI Splits
Decomposition Tree with AI Splits AnyChart Users drill into any metric across any dimensions, in any order — and find what drives the numbers. All on a single sheet, all on their own. With AI Splits revealing the key impacts automatically. Discoveries Well-known from Power BI, decomposition trees aren't available in Qlik natively. This extension fills that gap — letting users drill down across multiple dimensions in any order, with AI... Show MoreDecomposition Tree with AI SplitsAnyChart Users drill into any metric across any dimensions, in any order — and find what drives the numbers. All on a single sheet, all on their own. With AI Splits revealing the key impacts automatically.
Discoveries
Well-known from Power BI, decomposition trees aren't available in Qlik natively. This extension fills that gap — letting users drill down across multiple dimensions in any order, with AI Splits automatically surfacing the highest and lowest impact factors on any measure.
Impact
A hands-on feature walkthrough: AI Splits, flex dimension ordering, multiple measures, conditional coloring, negative value handling, three bar scaling modes, zooming, and paging. Everything configured and ready to inspect in edit mode.
Audience
Qlik developers and BI consultants looking to add root cause analysis and ad hoc exploration to their Sense apps.
Data and advanced analytics
Built with AnyChart's Decomposition Tree extension for Qlik Sense / Qlik Cloud, based on fictional business data.
-
New Centers of Excellence in India
This year, in April, we inaugurated two new Centers of Excellence ( CoE) under the Qlik Academic Program, in the Silicon Valley of India, i.e Bangalore. The new CoEs mark a new beginning for training and skilling students in Qlik technologies along with other activities like datathons. Reva University is one of the leading Universities in the State of Karnataka and is ranked among the top universities in the region. The School of Computer Science... Show MoreThis year, in April, we inaugurated two new Centers of Excellence ( CoE) under the Qlik Academic Program, in the Silicon Valley of India, i.e Bangalore. The new CoEs mark a new beginning for training and skilling students in Qlik technologies along with other activities like datathons.
Reva University is one of the leading Universities in the State of Karnataka and is ranked among the top universities in the region. The School of Computer Science and Engineering took the lead in this initiative and has established the CoE. Strategic Partner of the Qlik Academic Program, ICT Academy established the connection with Reva and ensured that arrangements were made as per the requirements of the CoE.
The second CoE was established in Sai Vidya Institute of Technology ( SVIT) which is a well known institution for engineering students. Many students have earned their degree qualification from here. The Department of Computer Science Engineering have been coordinating to establish the CoE. Many initiatives are planned by SVIT to take this engagement ahead.
The previous CoEs are functioning successfully in VJIT Hyderabad, Anurag University Hyderabad and Kristu Jayanti University Bangalore. Many students have got trained and qualified from the CoEs here. Along with this, they have hosted various events including datathons successfully.
We hope to establish more CoEs this year and create a physical space for students to get trained under the Qlik Academic Program.To learn more about the academic program, please visit: qlik.com/academicprogram
-
May the Data Flow: Qlik Replicate's May 2026 Technical Preview is Live
It's May — and just like a certain galaxy far, far away, things are heating up. The Qlik Replicate May 2026 Technical Preview has landed, and it's ready for you to put through its paces. -
Qlik Talend Administration Center - Security Patches Available
The following two Qlik Talend Administration Center security issues have been identified and subsequently resolved. Patches are already available. URL access control vulnerability (CVE-2026-9057) A broken access control issue has been identified in Qlik Talend Administration Center, which allows a user with View permission to modify the Qlik Talend Studio update URL. Affected Software All versions of Qlik Talend Administration Center before P... Show MoreThe following two Qlik Talend Administration Center security issues have been identified and subsequently resolved. Patches are already available.
URL access control vulnerability (CVE-2026-9057)
A broken access control issue has been identified in Qlik Talend Administration Center, which allows a user with View permission to modify the Qlik Talend Studio update URL.
Affected Software
- All versions of Qlik Talend Administration Center before Patch_20251121_QTAC-1471_R2025-11_v1-8.0.1.
See Security fix for Qlik Talend Administration Center URL access control vulnerability (CVE-2026-9057) for details.
Cross-site scripting vulnerability (CVE-2026-9056)
A stored cross-site scripting security issue in the Qlik Talend Administration Center has been identified.
Affected Software
- All versions of Qlik Talend Administration Center before Patch_20260123_QTAC-1883 (cumulative patch)_R2026-01_v1-8.0.1 are affected.
See Security fix for Qlik Talend Administration Center cross-site scripting vulnerability (CVE-2026-9056) for details.
Recommendation
Upgrade at the earliest. The following table lists the patch versions addressing the vulnerabilities.
Always update to the latest version. Before you upgrade, check if a more recent release is available.
Product Patch Release Date Qlik Talend Administration Center
URL access control vulnerabilityQTAC-1471 November 21, 2025 Qlik Talend Administration Center
cross-site scripting vulnerabilityQTAC-1883 January 23, 2026 Thank you for choosing Qlik,
Qlik Support -
Qlik Automate: Automation ownership changes for Analytics Admins May 2026
Qlik introduced a change in how automation permissions are handled for the Analytics Admin role. When was the change introduced? The change is already live as of the 11th of May, 2026. What does that mean for me? Analytics Admins can now claim ownership of another user's automation. After claiming ownership, they can make necessary changes to it and enable the automation. However, they can no longer transfer ownership to another user. How do ... Show MoreQlik introduced a change in how automation permissions are handled for the Analytics Admin role.
When was the change introduced?
The change is already live as of the 11th of May, 2026.
What does that mean for me?
Analytics Admins can now claim ownership of another user's automation. After claiming ownership, they can make necessary changes to it and enable the automation. However, they can no longer transfer ownership to another user.
How do I claim ownership of an automation?
As an Analytics admin, to claim ownership of an automation:
- Navigate to the Automations section in the Administration Console
- Locate the automation you want to claim ownership of, and click the Actions menu (...)
- Choose Claim ownership
This behavior change only applies to Analytics Admins. Tenant admins can still transfer ownership to any user with the appropriate access rights in the tenant.
If you have any questions, we're happy to assist. Reply to this blog post or take your queries to our Support Chat.
Thank you for choosing Qlik,
Qlik Support