Unlock a world of possibilities! Login now and discover the exclusive benefits awaiting you.

Analytics & AI
Forums for Qlik Analytic solutions. Ask questions, join discussions, find solutions, and access documentation and resources.
Data Integration & Quality
Forums for Qlik Data Integration solutions. Ask questions, join discussions, find solutions, and access documentation and resources
Explore Qlik Gallery
Qlik Gallery is meant to encourage Qlikkies everywhere to share their progress – from a first Qlik app – to a favorite Qlik app – and everything in-between.
Qlik Community
Get started on Qlik Community, find How-To documents, and join general non-product related discussions.
Qlik Resources
Direct links to other resources within the Qlik ecosystem. We suggest you bookmark this page.
Qlik Academic Program
Qlik gives qualified university students, educators, and researchers free Qlik software and resources to prepare students for the data-driven workplace.
Recent Blog Posts
-
How IntervalMatch Solved My Profit and Loss Dilemma
Of the 2 ½ years I have been with QlikTech, I have never had to use the IntervalMatch prefix in any of my scripts but I recently found out how powerfu... Show MoreOf the 2 ½ years I have been with QlikTech, I have never had to use the IntervalMatch prefix in any of my scripts but I recently found out how powerful it can be. I was tasked with creating a Profit and Loss (P&L) statement in QlikView based on the format outlined in this Excel file.
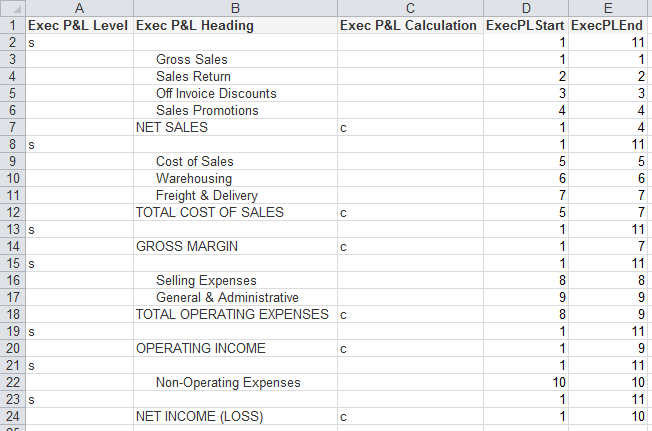
- The “s” in the Exec P&L Level column indicates blank rows
- The “c” in the Exec P&L Calculation column indicates rows where a calculation needs to be performed
- The Exec P&L Heading column stores the headings that are to be used in the P&L statement
- The ExecPLStart and ExecPLEnd columns indicate the range of rows that are to be summed
Who would have thought something as simple as IntervalMatch would solve my problem? I have always said that I learn something new about QlikView every day and this day was no different. I was able to load my master account information, my account balance information and then perform the IntervalMatch, using the reporting code field from the master account table, to get everything in sync so that the correct rows were summed in the P&L statement. Then all I needed to do was create my chart (a straight table) in QlikView. In the end my chart looked like the image below and I was quite pleased.
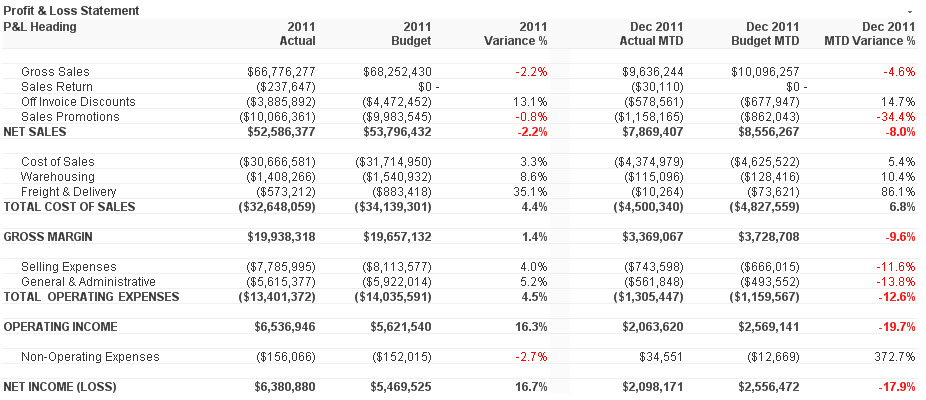
I wrote a technical brief about how I completed this task. I know this is just one of the many ways IntervalMatch can be used. I am sure in the future I will learn some of the other ways.
-
Data Literacy: The Results Are In
Data literacy is a journey, one that students and professors are starting to attack head on. Thanks to the Academic Program, professors and students c... Show More
Data literacy is a journey, one that students and professors are starting to attack head on.
Thanks to the Academic Program, professors and students can become data literate for free! If you don't have an active membership we encourage you and others to visit The Qlik Academic Program to apply!
To read the new article about Data Literacy visit https://blog.qlik.com/data-literacy-the-results-are-in

-
My Pleasant Surprises Learning Qlik - a multi-part series
Coming from a traditional business intelligence and ETL background where I’ve used both proprietary and open source solutions – things like OLAP, data... Show More
Coming from a traditional business intelligence and ETL background where I’ve used both proprietary and open source solutions – things like OLAP, data modeling, SQL, 4GLs, semantic layers and even coding dashboards were commonplace for many years. So when I started with Qlik, I was not only thrilled, but quite biased towards the way I manged and created analytics . As I set out to build my first Qlik application I immediately had many questions:- Where do I build my semantic / metadata layer?
- Where is my data modeler tool to define my table relationships?
- How do I place parameters to pass where-conditions to my database?
- How do I wire my visualizations to make my dashboards interactive?
As I set out on this journey to appreciate Qlik, I was surprised at what I found. In this multi-part blog series I will share with you some of my pleasant surprises that changed the way I create and work with analytics.
So let’s dive in further to my first Qlik pleasant surprise.
#1: Where's the "Semantic Layer"?!
NOTE: The subject matter in this topic can have many moving parts and is not meant to be a direct comparison to traditional BI or other data visualization tools. It is an expression of my experiences when first working with Qlik and meant to inform those who might have similar expectations when comparing Qlik to other BI tools.
A typical first step when using BI tools is that you usually create a metadata or semantic layer before you can begin creating your reports and dashboards. Depending on the tools being used, sometimes you even need to create more than one…one layer to support operational reporting and one to support interactive OLAP. (Often when a vendor's software stack combines a number of acquired tools, you may see this occur.) Creating abstraction layers such as these are usually performed by BI administrators whom are familiar with the data. Metadata / semantic layers provide a unified, consolidated view of data across the organization. They are important middlemen that connect back-end data to BI client tools and add a layer of governance and security. These centralized repositories store many attributes of your data including specific attributes used by the tools:
- Connection information
- Business friendly field names
- Field and row-level security
- Aggregations
- Data modeling properties such as keys, and referential integrity
- Calculated expressions
Once a semantic layer is prepared, the BI client tools can begin using the "data models", "business objects", "data dictionary" etc, to create reports and dashboards.
Now, when I started working with Qlik, I was unsure how this step was performed -OR- perhaps what I was doing seemed more transparent and less rigid than what I was used to. For starters I could quickly load data directly from many sources and go directly into my analysis. Qlik simply loads and indexes data into its apps during the app creation. These apps then operate within an associative indexing engine. (more on that in another article) - If I wanted to add multiple sources, I can visually profile the data and define relationships automatically - no complex data modeling or SQL required. I did not need to worry if I was "joining" correctly or even understand the relationships of the tables. I found this to be a huge time-saver and the process was fairly simple to navigate. This was indeed a pleasant surprise.
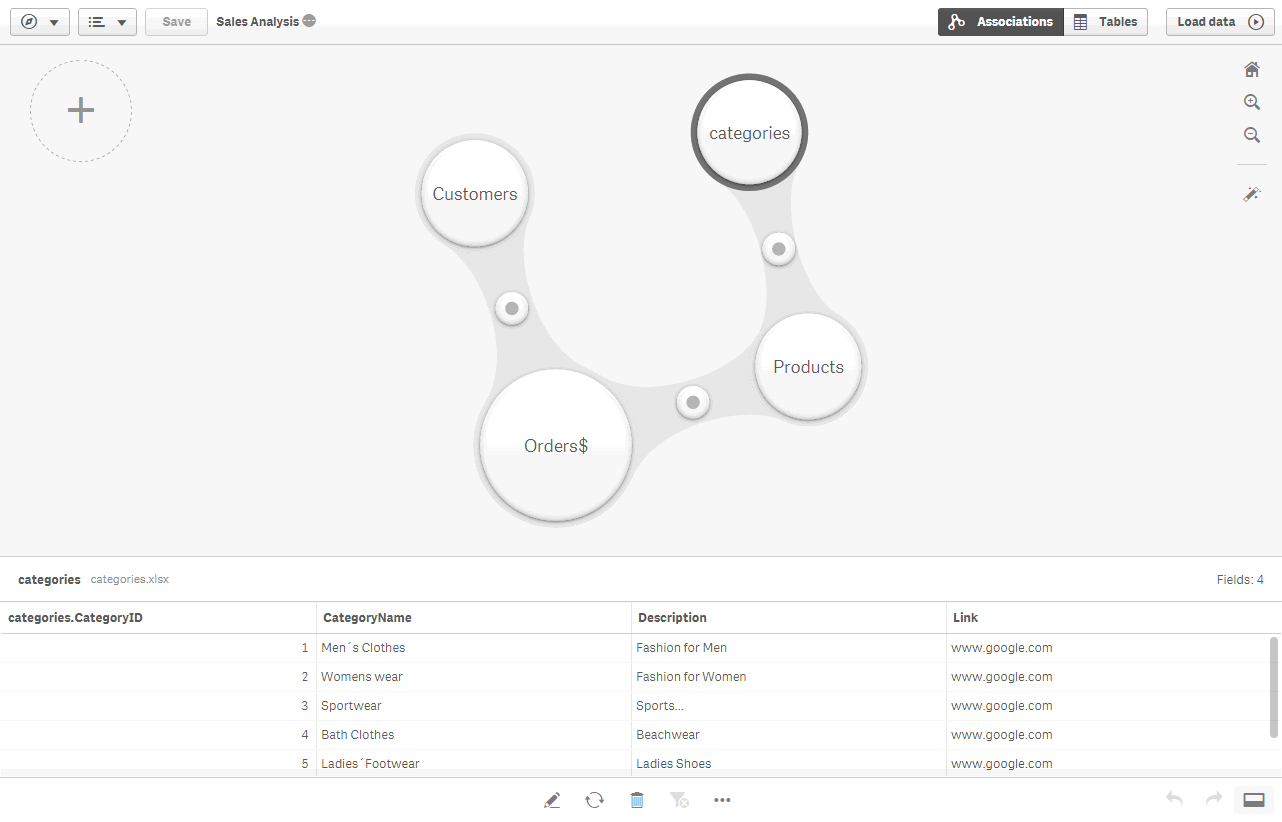
Once the data was loaded into the app, I immediately had access to my fields and could begin creating my analysis. In addition, I discovered that I can also set up reusable expressions, measures, dimensions and even predefined visualizations, through a feature known as Master Items. Master Items are defined in the Qlik Sense App rather than a centralized server. They allow business users to use a pre-defined library of assets so they can easily create and customize visualizations. (Note: Master Items are more beneficial to users of Qlik Sense Enterprise as opposed to those using Qlik Sense Desktop.)
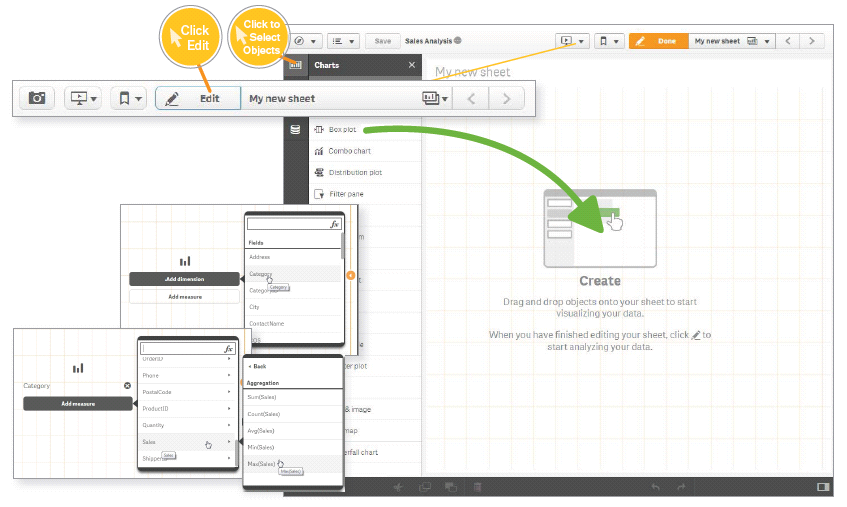
This was a pleasant surprise as it was extremely easy to get started with Qlik and cut my data preparation time significantly, in turn giving me more time to create my analysis.So basically, I discovered that Qlik, defines its "semantic layer" within the app itself, as opposed to a separate repository?!? Hmmm.....
A healthy debate ensues
To some degree, I understand there are some opinions about this approach, and some may say "That's not a semantic layer". Now there are ways that you can export a Qlik data model and data index, created within the app, to disk (.qvd) and use them with other applications. This has been done widely and successfully by many of our customers. But...with the new Master Items approach introduced in Qlik Sense, we needed a way to centralized those assets for other applications as well, so our team of experts have created a Qlik Powertool, the Governed Metrics Service.
"The Governed Metrics Service (GMS) Powertool provides the ability to control and provision the use of governed Master Items. GMS loads externally defined metrics and applies them to one or more designated applications. GMS will quickly have you on the right track to governed self-service."
To learn more about GMS check it out here: Introduction - EA Powertools Governed Metrics Service
My journey with Qlik is no where near completed and I anticipated many more pleasant surprises. Next week I'll cover another pleasant Qlik surprise that helped me uncover things in my data I had not idea existed. Have a comment or question, a pleasant surprise you want to share? We want to hear from you. Use the comments section below to ask a question and join the discussion.
Regards,
Michael Tarallo (@mtarallo) | Twitter
QlikFor starters, if you are a visual learner and new to Qlik, take a look at this brief video to get an idea of how to provision from multiple tables using Qlik Sense:
NOTE: To increase resolution or size of the video, select the YouTube logo at the bottom right of the player. You will be brought directly to YouTube where you can increase the resolution and size of the player window. Look for the 'settings' gears icon in the lower right of the player once at YouTube. (video and sample files)
For more videos that can help you get started with Qlik Sense:
-
Qlik Web Connectors for Qlik Sense, QlikView and Cloud
Hey Guys! Thanks for taking a moment to read this blog and view the brief 60 second video on our Qlik Web Connectors. It is no surprise that we are su... Show More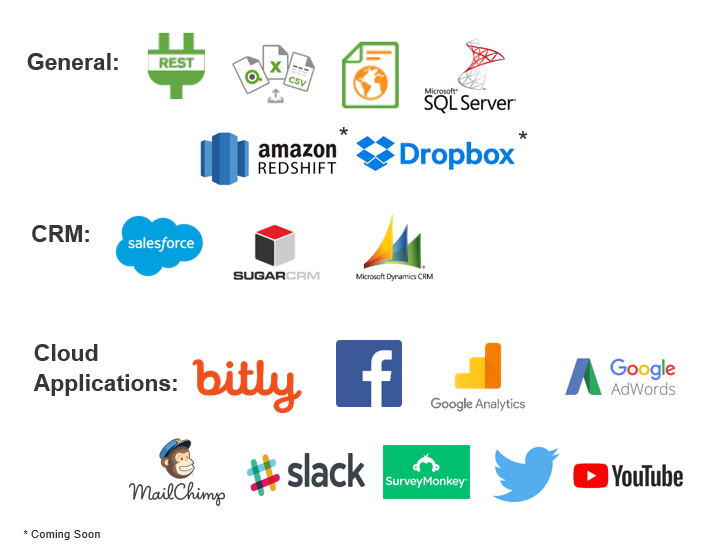 Hey Guys! Thanks for taking a moment to read this blog and view the brief 60 second video on our Qlik Web Connectors. It is no surprise that we are surrounded by mountains of data. But, what good is it if you don't have easy access to it? I'm not talking about data that sits in traditional files and databases. I'm talking about data that sits in numerous cloud-based services, social media and web sites.Depending on your business, this data can contain valuable insights that help you make better decisions as wells as customer sentiments that help improve your products and services.
Our Qlik Web Connectors is the answer to your additional data needs, whether its from a cloud-based CRM, data warehouse or social media application. Watch the below video to learn how simple it is to fetch this data and bring it directly into your Qlik Sense or QlikView environments. And...Qlik Sense Cloud Business subscribers, guess what, you have access it to them too!
Qlik Sense in 60 - Qlik Web Connectors
NOTE: To increase resolution or size of the video, select the YouTube logo at the bottom right of the player. You will be brought directly to YouTube where you can increase the resolution and size of the player window. Look for the 'settings' gears icon in the lower right of the player once at YouTube.
Qlik Sense Cloud Business Subscribers:
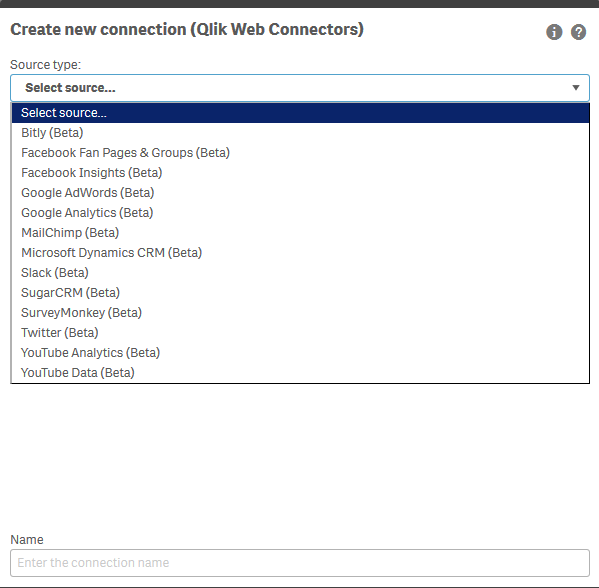
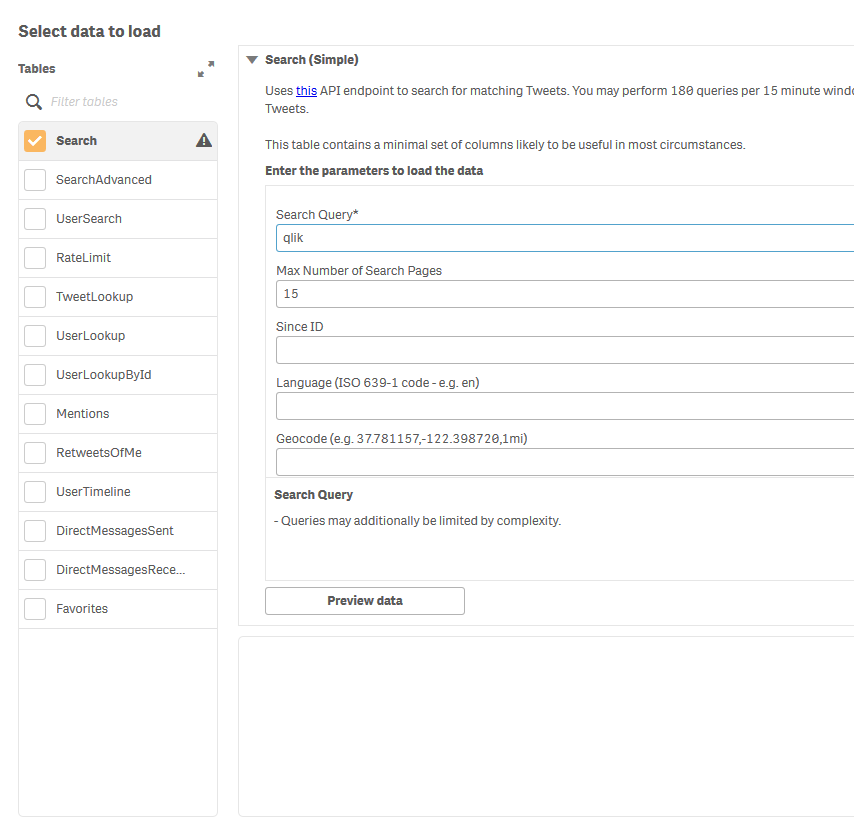
As stated in the video, Qlik Sense Cloud Business subscribers can also get immediate access to a great selection of many of our web connectors, with more being added on a regular basis. With Qlik Sense Cloud Business, subscribers can quickly and easily fetch data from many web-based sources with a new integrated connector selection list and query manager. The addition of these features, eliminates the need to copy and paste any script as you would when using the standalone Qlik Web Connector service.
How-To Videos
- Google Analytics - Qlik Sense Cloud Business Web Connectors - Video 1
- Twitter - Qlik Sense Cloud Business Web Connectors - Video 2
- Facebook - Qlik Sense Cloud Business Web Connectors - Video 3
For more information on a list of Web Connectors just released for Qlik Sense Cloud Business check out our recent announcement here: Getting More Connected in the CloudAdditional Web Connector Resources:
Learn more from my colleague Adam Mayer who shows some brief examples using Twiter, Facebook and Google Analytics:
- Qlik Snippets: Qlik Google Analytics Connector - YouTube
- Qlik Snippets: Qlik Facebook Fan Pages & Group Connector - YouTube
- Qlik Snippets: Qlik Twitter Connector - YouTube
- Web Connector on-line help documentation
We want to hear from you, so please join the conversation by posting your questions and comments below.
Regards,
Mike Tarallo
QlikCan't see the video?
Download the .mp4 and watch from your computer or mobile device
-
The Missing Piece of the Adoption Puzzle
Organizations everywhere are switching to cloud-based and subscription-based software to run their business. This presents some great benefits, but a... Show More
Organizations everywhere are switching to cloud-based and subscription-based software to run their business. This presents some great benefits, but also a new, significant challenge for user adoption.Cloud-based software is typically updated with the latest and greatest technology.This means that the users must continuous learn these new technologies and competencies to maximize value from the software.This also requires more of an investment in user adoption to make the software sticky for the users and for organizations to realize its value.At the same time, education and learning approaches are not keeping up and organizations are not adapting their learning to fit today’s ever-changing work environment.To keep pace, organizations need to think about user adoption and getting users properly enabled completely differently than before.
To read more visit the blog posted by the Vice President of Education Services, Kevin Hanegan
https://blog.qlik.com/the-missing-piece-of-the-adoption-puzzle
-
The Concat Function
QlikView has many useful and sometimes underused functions that can make your life as a developer a lot easier. One of these is CONCAT(). This should ... Show MoreQlikView has many useful and sometimes underused functions that can make your life as a developer a lot easier. One of these is CONCAT(). This should not be confused with the CONCATENATE script keyword.
In its simplest form, CONCAT() is used to string together values/words/selections in to one string. However, it can be utilized in a number of ways to help you solve different problems.
All of the examples in this post are based on the data in the table below.....
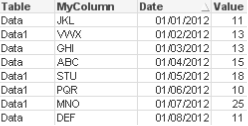
I have shown a few simple but useful examples below to hopefully help you in your everyday QlikView development!
Simple String Concatenation
As mentioned earlier, the function lets you string together a list of values. These values can be hard coded or driven my selections/data.
=CONCAT(MyColumn,',')
=CONCAT(DISTINCT MyColumn,',')
This simple concat statement would string together all of the possible values from the column MyColumn. You may wish to add the DISTINCT keyword. This would ensure that each value is only displayed once in the string.
ABC,DEF,GHI,JKL,MNO,PQR,STU,VWX
When using a simple concat, you have the option to add a sort weight to the function to order the string values by a column of your choice. In the example below, I have added the date column to sort the values…..
=CONCAT(MyColumn, ',', Date)
Result: JKL,VWX,GHI,ABC,STU,PQR,MNO,DEF
Concat() within an expression/set statement
There are occasions when you want to pass a selection of values to a set statement. To do this I would need to add some single quotes to the string so that the CONCAT() function returns e.g. 'JKL','VWX'. But you cannot have the single quotes as they are, since they then would be interpreted when the Concat is evaluated instead of when the set expression is evaluated. Instead I use the Chr() function:
=CONCAT(Chr(39)&MyColumn&Chr(39),',')
I can then pass this concat statement to the inside of an expression…
=Sum({<MyColumn={$(=CONCAT(Chr(39)&MyColumn&Chr(39),','))}>} Value)
In most instances, this technique would be used where data islands are present. It lets me pass values to an expression that will not affect any part of the data model as the data island table is not joined to it.
Concat() in the Script
Concat can also be utilised in the script to let you convert multiple rows in to one single column value, just as any other aggregation.
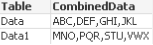
Remembering the source data we have earlier in the blog. The result of script side CONCAT can be seen below...
Using Rank() to influence the Concat()
When you start to utilise other function in conjunction with concat() you can start to achieve to clever results. In this example, I have used Rank() to grab the top 3 performers (based on Value) and string them together.
=CONCAT(IF(aggr(Rank(sum(Value)),MyColumn)<=3,MyColumn),',')
Result: ABC,MNO,STU
So as you can see, there are a number of uses for CONCAT(). Let's if you can find more!
For more information, please refer to the Technical Brief here.
ABY.

-
With Advanced Analytics, It's People (Not Data) That Stand In The Way Of Change
Now more than ever we are seeing the importance of learning what Data Analytics is and why its a crucial part of everyday business. Today students gr... Show More
Now more than ever we are seeing the importance of learning what Data Analytics is and why its a crucial part of everyday business. Today students graduating with a background in analytics are much more likely to be hired due to the lack of employees with analytical skills.
To further explain this idea, Forbes released an article recently highlighting the growing skills gap between analytics and employees.
To read the full article visit https://www.forbes.com/sites/baininsights/2017/10/16/with-advanced-analytics-its-people-not-data-that-stand-in-the-way-of-change/#49fb5a5a3d1c
To help solve this gap, the Academic Program has been teaching analytics to professor and students for a number of years! We encourage you to share all that Academic Program has to offer to professor and students so they too can learn the important skills needed to take advantage of this growing market!
-
QlikView November 2017 Technical Preview Release
Qlik customers & partners are invited to join the QlikView November 2017 Technical Preview. This Preview includes new features and improvements like:A... Show MoreQlik customers & partners are invited to join the QlikView November 2017 Technical Preview. This Preview includes new features and improvements like:
- Analytic connections - With analytic connections, you can integrate external analysis with your business discovery. By configuring an analytic connection (through server-side extensions), you can extend the built-in expression library with support for calling third-party calculation engines, both for load script and for chart expressions.
- WebClient improvements like switch language, Detach, Set reference, Copy single column selection, Copy cell
- Shared files management improvements - improved stability, shared file cleaning, PGO buffering
- Export in XLSX format - XLSX is now the default exporting format for Excel files, replacing XLS.
- BNF script reload mode - A new script reload mode, BNF, has been introduced. It uses the same syntax checks as those in the Script editor.
- KML support - QlikView now can read KML files for use in a map visualizations. The KML file can represent either area data, such as countries or regions, or point data such as cities or places.
- LEF Control on Maintenance date - When upgrading the QlikView Server or QlikView Desktop, LEF files must be up to date.
Try out these new capabilities and improvements and use the community to give your feedback on this new release of QlikView.
If you have any question or have issues accessing the community please send an email to insight@qlik.com.
-
Qlik Qualification for Students
Last week we announced our brand new Qlik Qualifications, now allowing students to use their QCC knowledge and in classroom BI experience to become an... Show MoreLast week we announced our brand new Qlik Qualifications, now allowing students to use their QCC knowledge and in classroom BI experience to become an academically qualified student as either a Business Analyst or a Data Architect.
But what is the difference between each pathway?
Business Analyst

This qualification exam tests your basic skills and applied knowledge of the Qlik Sense product.
Tested skills include building Qlik Sense visualisations for data analysis, creating master items for business user consumption, incorporating new data from text/Excel files, and understanding how to use and build bookmarks, snapshots and stories for collaboration.
Data Architect

This qualification exam tests your basic skills and applied knowledge of the Qlik Sense product.
Tested skills include understanding data modelling concepts, generating, debugging and troubleshooting the load script, incorporating new data using external files and data sources, and creating master items for business user consumption.
We're very excited to be able to offer this option for students and assist towards their careers in analytics or where ever that might be. The qualifications can be viewed on the QCC platform through the Academic Program tab.
-
Getting More Connected in the Cloud
We are excited to be closing in on the first year of Qlik Sense Cloud Business!One of the main areas of focus this year for our customers and cloud de... Show MoreWe are excited to be closing in on the first year of Qlik Sense Cloud Business!
One of the main areas of focus this year for our customers and cloud development team has been the addition of a broader range of data connectivity options within Qlik Sense Cloud Business. Recently, you may have noticed the addition of direct data connectivity to the following applications:
- Bit.ly
- Facebook Insights
- Facebook Pages (expanded tables, including LikesforItem, CommentsforItem, and CommentsandReplies)
- Google Analytics (expanded tables, including MetaDataColumns, CustomMetrics, CustomDimensions, and Goals)
- MailChimp
- Microsoft Dynamics
- Slack
- SugarCRM
- SurveyMonkey
Using the New Connectors
Configuration and authentication for these newest connectors is similar to the processes for existing web connectors – after entering your basic account information for the various cloud applications, you can access an authentication code to establish the connection. Look for the new connectors in the data load editor, under Qlik Web Connectors:
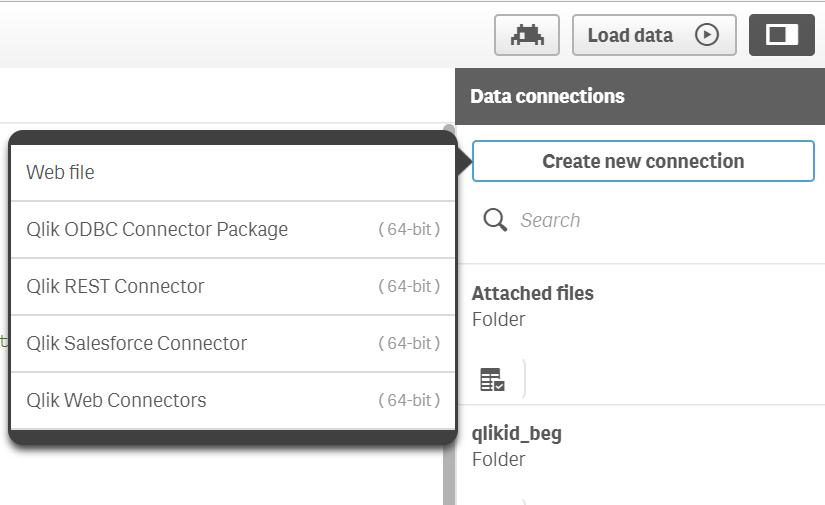
Connectors in Qlik Sense Cloud Business
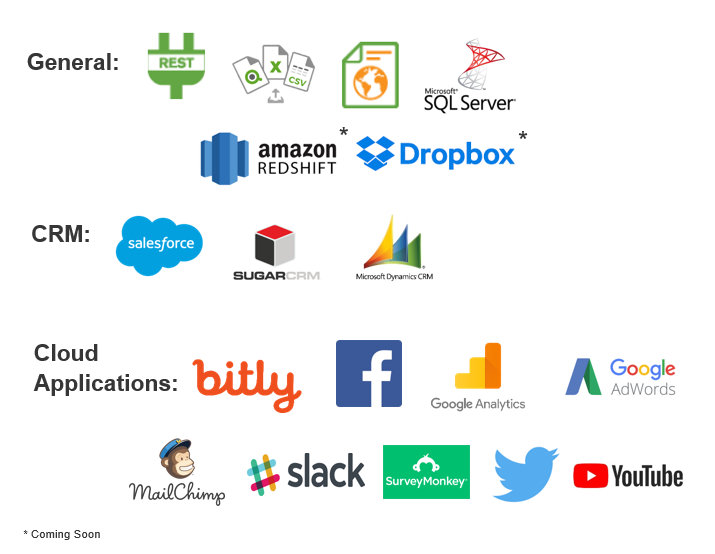
These new additions help bring more of the core Qlik Sense experience to Qlik Sense Cloud Business. Qlik’s Associative Difference empowers users to easily connect to business-critical data and immediately benefit from the ease of exploring multiple data sources together, at once. That’s why we’ve ramped up connectivity to both cloud and on-premises sources, as well as more flexible options like REST, web files, and Dropbox (coming soon!). The full list of connectivity included in a Qlik Sense Cloud Business subscription now looks like this:
This recent release of connectors means that Qlik Sense Cloud Business now includes direct connectivity to the three of the market-leading CRM applications, so you can easily dive deeper into customer, sales and marketing data. Interested in creating a CRM dashboard or app? Head over to our demo site and explore the CRM demo app, as well as some other tips and tricks for getting the most out of your CRM data.
More Qlik Sense Cloud Business highlights:
- 30 Day Trial - The free trial period for Qlik Sense Cloud Business is now 30 days. If you have been interested in learning more about Qlik Sense or experimenting with cloud analytics, take advantage of the extended free trial period to create and share apps. Go to qlik.com/cloud to create a Cloud Basic subscription, then upgrade in-product.
- Customer Story - Curious about how other organizations use Qlik Sense Cloud? Hear from Wayne Printy, CFO, LincolnHealth - a Qlik Sense Cloud Know It All!
- Learn More - Our Cloud Success Team is always ready to help you get the most of your Qlik Sense Cloud Business subscription. Sign up to attend a live, interactive webinar with the team to get your questions answered and learn more.
-
Limited Load and the First Prefix
Have you ever had an application that takes a long time to reload and you dread making changes to the script because that would require you to wait un... Show MoreHave you ever had an application that takes a long time to reload and you dread making changes to the script because that would require you to wait until the reload is complete to make sure your changes are working correctly? Well QlikView and Qlik Sense both provide options that allow you to test your script without waiting for the entire reload to complete – Limited Load and the First prefix.
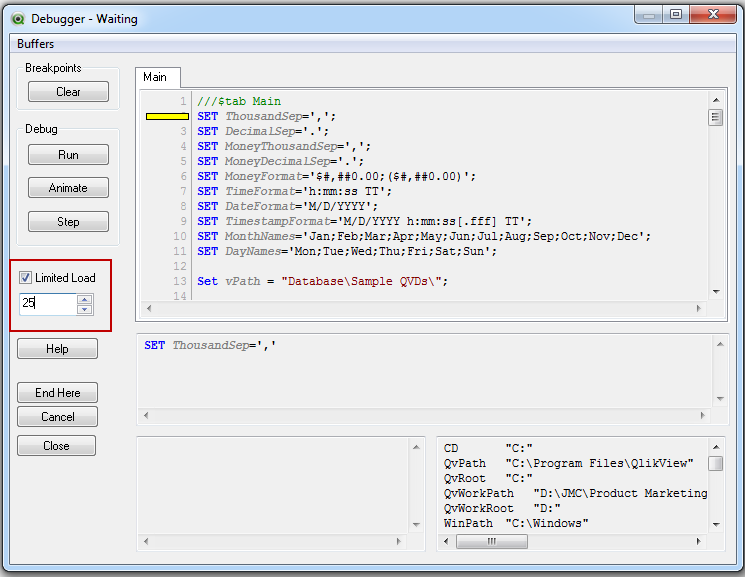
QlikView and Qlik Sense have Debug capabilities that allow you to do a Limited Load. With each product, you can enter the maximum number of records that each Load and Select statement can load. This reduces the execution time of the reload but still lets you to test that the script runs properly. Limited load can be very useful when the data sources are large or when you are testing with live data and want to keep the execution time low.
In QlikView and Qlik Sense, you can access the Debug window from the script editor. In QlikView, you can find it in the File menu or on the toolbar.

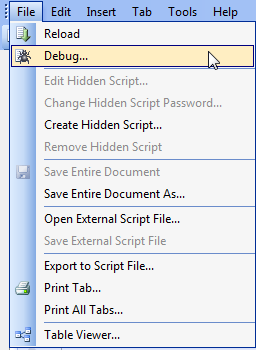
The Debug window looks like the image below. You can check the Limited Load checkbox and enter the maximum number of records you want loaded with each Load and Select statement.
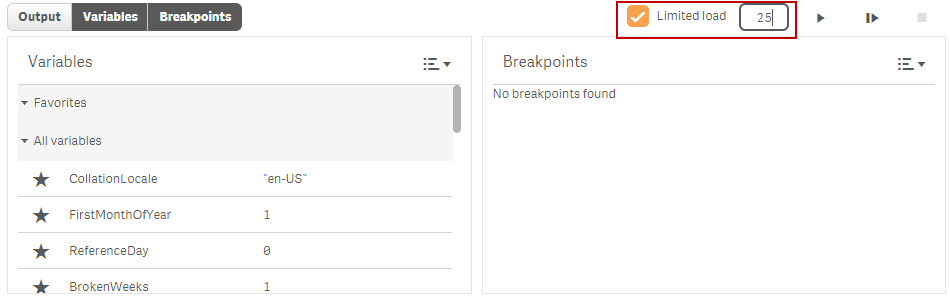
In Qlik Sense, you can also access the Debug panel from the Data Load Editor.

Clicking on the Debug icon opens the Debug panel at the bottom of the page. You can check the Limited Load checkbox and then enter the maximum number of records you want loaded with each Load and Select statement.
Another option that can be used to reduce the number of records loaded is the First prefix. This can also be used with a Load or Select statement to set the maximum number of records that are loaded. The difference between the Limited Load and the First prefix is that the Limited Load will apply to all Load and Select statements in the script whereas the First prefix is manually added to each Load or Select statement that it should apply to. For example, I could run the script below to load only 10 customers from the Customers QVD.
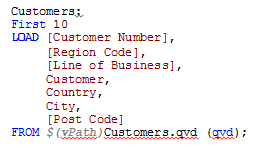
The First prefix can be written as it is above or with parenthesis like this: First (10) LOAD. If there are many Load and Select statements in the script, a Limited Load may be easier to use but if there are only a few Load/Select statements or if there is one data source in particular that has a lot of records, then the FIRST prefix may work best.
Keep in mind when using Limited Load or the First prefix that all the data may not be loaded and you may find that visualizations are not showing data or that selections are not providing the expected result. This is really noticeable if you do a Limited Load with only a few records like 5 or 10. When using Limited Load or First, the data that is loaded may not be associated so you may end up with tables in the data model with disconnected data. That is ok, once you do a full reload, everything will look as you expect.
Limited Load and the First prefix both can reduce the execution time of the reload script which can be helpful when you want to just test a script or when you are testing with a live data source. There are times when you need to load all the data in order to ensure that the script logic is working – it all depends on the specific application - but it is good to know when working with large data sources that there are options that can reduce the reload time.
Thanks,
Jennell
-
Are you in need of Data?
Searching for clean data can be difficult but the Academic Program is here to steer you in the right direction! Kaggle provides a wide range of data ... Show More
Searching for clean data can be difficult but the Academic Program is here to steer you in the right direction!
Kaggle provides a wide range of data sets for any classroom or project. If you need data we recommend visiting Datasets | Kaggle.
-
Amazing New Qlik Academic Resources FOR YOU!
We are excited to announce the Qlik Academic Program is expanding, and we have BIG news to share! Members currently receive free Qlik software, free ... Show MoreWe are excited to announce the Qlik Academic Program is expanding, and we have BIG news to share! Members currently receive free Qlik software, free training through the Qlik Continuous Classroom (QCC), and a free Data Analytics Curriculum to help professors introduce data literacy concepts to their students.
In addition, members will now receive the following:
· Qlik Sense Qualification: After learning skills in the QCC, and applying your skills using Qlik products, you can test your knowledge to earn a Qlik Sense Qualification! Two qualifications are currently available: Business Analyst Qualification and Data Architect Qualification. After passing a two-part exam, you will receive a printable certificate and a digital badge to share on your resume, LinkedIn, and other social sites.
· Data Analytics Curriculum: We have updated and expanded the curriculum!
o Students can now access on-demand videos to learn data literacy concepts at their own pace.
o UPDATED Data Visualization Course: We have added complementary videos with new activities and a real-world, interactive business use case.
o NEW Introduction to Data Analytics Course: We have created a new course which provides lecture materials for professors, handouts, activities and a real-world, interactive business use case.
· The QCC Platform: We have migrated all our resources to the QCC! Now you can access the free training, the curriculum, and the qualification exams all in one place. Simply log into the QCC using your Qlik Account username and select “Academic Program” on the menu at the top of the QCC homepage.
If you are currently an active member of the Academic Program, you will automatically receive access to these amazing new resources. If it's been more than a year since you last applied, we recommend you check us out by visiting http://www.qlik.com/us/company/academic-program. There you can apply as a professor or students and receive access to all these wonderful resources!
-
A Culture of Data Literacy
When we think of the word “culture”, or phrase “corporate culture”, many thoughts can come to our mind, some positive and some negative. In my first ... Show More
When we think of the word “culture”, or phrase “corporate culture”, many thoughts can come to our mind, some positive and some negative. In my first blog post, The Rise of Data Literacy, we spoke of the data revolution and of data literacy itself. But for organizations to succeed with data literacy, the right frame of mind and data literacy culture must exist. What does the phrase “data literacy culture” mean? How can an organization implement and put in place the proper culture to ensure it starts to grow within data literacy and progresses with the data revolution?
To read the full article visit A Culture of Data Literacy | Qlik
-
Qlik Sense September 2017 is now available
Qlik Sense September 2017 is now available from our Customer Download Site. You can also try out many of the new capabilities in Qlik Sense Cloud ... Show MoreQlik Sense September 2017 is now available from our Customer Download Site. You can also try out many of the new capabilities in Qlik Sense Cloud where you can use Qlik Sense Cloud Basic for free or try Qlik Sense Cloud Business with a free 30 day trial.
You will find many new features and capabilities in this release including:
- For Business Users
- Waterfall Chart - You can now illustrate how an initial value is affected by intermediate positive and negative values with the new waterfall chart. For example, you can show the positive and negative contributions of different accounts in an income statement.
- Recent Colors- The color picker in Qlik Sense now displays the five most recent colors selected in Qlik Sense
- Expression Driven Labels – Provides the ability to use expressions in labels for dimensions and measures in property pane. E.g. This allows you to add dynamically calculated values into the labels on your charts.
- Box Plot Chart Improvements – Addition of lasso and range selection, reference lines, and vertical orientation in the box plot chart that was introduced in June.
- Pivot Table Improvements – Ability to expand and collapse all items within a pivot table.
- Data Manager Sequential Operations - Improvements to Data manager enable you to perform sequential transformations on your tables and fields. Where previously you were limited in what transformations you could perform together, such as being able to apply a single data profiling card transformation on a single field, you can now use the data profiling cards, concatenation, calculated fields, and unpivoting data together.
- For Administrators
- Centralized Logging - With the introduction of shared persistence, all nodes now have direct access to a common database and file system. The new Qlik Logging Service allows administrators to configure logs to be centralized by collecting all the messages and inserting them into a PostgreSQL database to help find issues and analyze usage.
- Qlik Sense Mobile - This option is only available for customers who have an MDM app store hosted in-house and who have deployed Qlik Sense Enterprise. The Qlik Sense Mobile app can be downloaded fromhttps://vpp.itunes.apple.com
- For Developers
- Hierarchical Data API - A new hierarchical data API enables a definition that more closely reflects the visual representation of data. Benefits of the new API: Ensures little to no manipulation or transformation of data structure in the front end. / Simplifies the creation of charts./ Enables more powerful and dynamic charts.
- Visualization API Update – Addition of new waterfall chart.
- Extension Certification Pilot - Initial implementation of a new process for certifying extensions for Qlik Sense.. This is a limited implementation but ultimately we will offer partners the opportunity to apply for certification and to make certified extensions for sale via Qlik Market.
Attached you will find a document which outlines these features as well as an overall view of the improvements that have been released over the past 12 months.
------------
Join us in a city near you!
From October 3rd to November 16th we will be visiting cities around the world for the Visualize Your World tour. Learn how Qlik’s cloud-ready analytics platform delivers value and how Qlik is building on its unique Associative Difference to drive a new wave of analytics across all your data, people, and ideas.
- For Business Users
-
FileSize Function
In the past, I have blogged about the FileName function and how I used it to generate data for my Qlik Sense app. Today, I thought I would blog about... Show MoreIn the past, I have blogged about the FileName function and how I used it to generate data for my Qlik Sense app. Today, I thought I would blog about another file function, the FileSize function. The FileSize function is a script function that can be used to return the size of a file or table. The FileSize function returns an integer for the size, in bytes, of the file specified or a table. The file can be a QVD, a text file, an Excel file or a table. The syntax is quite simple:
Syntax:
FileSize([filename])
I have used the FileSize function to determine if a QVD exists before I load it. In the example script below, I set the size of the CustomerMaster QVD to the vSize variable. Then I check the variable to see if a size was returned. If a size was returned meaning a QVD is there, I load the QVD. If the QVD does not exist then the FileSize function will return null.
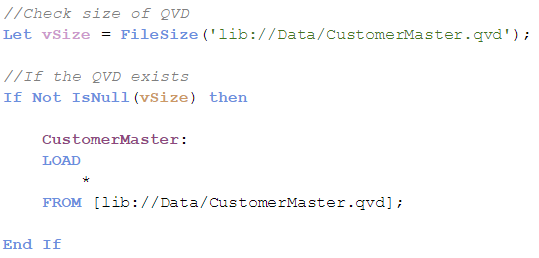
The FileSize function can also be used to return the table size of the table file being read. To do this, the FileSize function is used in the Load statement as seen in the example script below. When the filename parameter is excluded, then the FileSize function will return the size of the table currently being read. The TableSize field will store the size of the CustomerMaster table after it has been loaded.
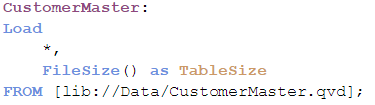
The FileSize function is another easy-to-use script file function that can be used in Qlik Sense or QlikView to provide the size of a file or a table. Use the FileSize function as a checkpoint in your script to ensure the file is available before loading, as I did in the example above, or use it ensure size requirements for files being loaded are being met in your app. Good luck scripting!
Thanks,
Jennell
-
Tips to improve your data literacy using Qlik Sense
Hello Qlik Community! Qlik's Bruno Calver is back sharing his in-the-field experiences, building upon his User Experience white paper made available l... Show MoreHello Qlik Community! Qlik's Bruno Calver is back sharing his in-the-field experiences, building upon his User Experience white paper made available last year. This time he has authored a white paper on Data Literacy. Bruno has worked with many large global enterprises, helping them discover the value in their data and how to best represent it in order to drive results. During this time he has come across many different ways of working with data. This article tries to consolidate the key take-aways within the context of data literacy. Be sure to download the attached PDF at the bottom of this post to learn more.
Introduction
Literacy skills have always been top of the bill in the education system -- and for good reason. Equally, data literacy skills are climbing the agenda in today’s competitive business environment.
Organizations will soon rely less and less on pre-processed information and their gut instincts as a decision making paradigm. It is increasingly important for everyone to apply critical thinking skills to every problem and data set in order to achieve a competitive advantage and create truly innovative solutions.
However, for many of us it is not clear what data literacy means, let alone the skills and techniques that might help drive our own data literacy level. The attached article explores these concepts and provides 5 key areas to think about when analyzing your data - including practical examples:
- Trends & Context
- Internal & External Data
- Cohorts & Cell based analysis
- Averages, Aggregation & Distribution
- Bias & Non-Causal Correlations
Increasing data literacy skills can have a profound impact on organizations in the following ways:
- Increasing user adoption and awareness of analytical tools and capabilities
- Creating data driven cultures to enhance performance
- Unlocking more value from your data investment
If this sounds interesting, then please read the article and see what new things you can discover about the language of data…!

Bruno is a Principal Solution Architect working in the UK with some of Qlik’s enterprise customers. His passion is working with business people to turn disparate and otherwise mundane data sets into insights and stories that can engage their audience, drive change and inspire new ways of thinking.
-
QlikView and Qlik Sense
As most of you have noticed – I hope – we have now released a new product.Qlik Sense.Qlik Sense is not just a new release of QlikView. Instead it is s... Show MoreAs most of you have noticed – I hope – we have now released a new product.
Qlik Sense.
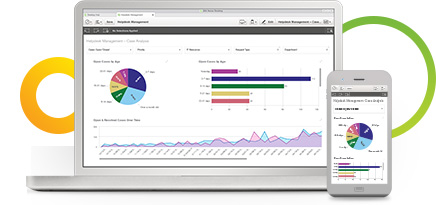
Qlik Sense is not just a new release of QlikView. Instead it is something different. But there are still so many similarities between the two products, so I thought it would be appropriate to dedicate a blog post to differences and similarities between the two.
Basically, the two products are two different user interfaces to the same analysis engine. This means that old scripts and old formulae will (almost) always work exactly the same way as before. (There are some smaller differences in that Qlik Sense uses libraries, and cannot always use relative paths for files.)
Hence, the two products both have the same Green-White-Gray logic; both use the same calculation engine; both have roughly the same response times; and you should use the same considerations for both when it comes to data modelling. This also means that many of the previous posts here on the Design Blog are just as relevant for Qlik Sense as for QlikView.
But the two products are still very different. And just as a parent cannot say that one child is better than the other, I cannot say that one product is better than the other. They are good at different things:
- QlikView is a tool for situations where you want prepared business applications, i.e. applications created by developers who put a lot of thought into the data model, the layout, the charts and the formulae; and deliver the applications to end-users who consume the applications. We call this Guided Analytics. The end-user has total freedom to explore data, select, drill down and navigate in the information, and can this way discover both questions and answers in the data. The end-user is however limited when it comes to creating new visualizations. This type of situation will without doubt be common for many, many years to come.
- Qlik Sense is a tool for situations where you don’t want to pre-can so much. Instead you want the user to have the freedom to create a layout of his own and in it, new visualizations; charts that the developer couldn’t imagine that the user wants to see. You want Self-service data discovery, which means a much more active, modern, engaged user. In addition, Qlik Sense is much easier to use when you have a touch screen, and is adaptive to different screen sizes and form factors. On the whole, Qlik Sense is a much more modern tool.
Finally, it is important to acknowledge that a piece of software is never ready. It evolves constantly:
Qlik Sense today is only the first version of something that will evolve further and get more features and functions as time goes on. Some of the features and functions of QlikView have not yet been implemented in Qlik Sense – there just hasn’t been time enough – but many of them will be implemented in coming versions.
Also QlikView is not yet a "final product". The product will be developed further, and most likely we will see some of the new functionality from Qlik Sense also in coming versions of QlikView. The goal is to use the same platform for both user interfaces.
With these two tools, we believe that we are well prepared for the future.

-
Launch of Centre of Excellence in Analytics-powered by Qlik!
Qlik in association with Vidya Jyothi Institute of Technology ( VJIT) launched its first ‘Centre of Excellence- powered by Qlik’ in IT city, also cal... Show MoreQlik in association with Vidya Jyothi Institute of Technology ( VJIT) launched its first ‘Centre of Excellence- powered by Qlik’ in IT city, also called India’s Genome Valley, Hyderabad on 11 September 2017.
This Centre was jointly inaugurated by the Chairman of VJIT and Anurag Institutions, Dr. P Rajeshwar Reddy and Qlik’s Academic Program Manager APAC, Pankaj Muthe. Dr. Reddy is also the Member of Legislative Council ( MLC) in the State of Telangana and its party Chief Whip.
This event was attended by Professors, Head of Departments of VJIT including its Director Dr. P Venugopal Reddy, Principal Dr. M. Padmaja and Dr. Siddhartha Ghosh-Professor and Training and Placement Head. Representatives from Qlik including Jaydeep Deshpande, Marketing Manager- India and SAARC and Fahad Khan, Solution Architect were also present. Support from team India and especially the Marketing, PR ( APAC) and Pre Sales team has been forthcoming for the successful launch of this Centre. Inputs at various stages were offered by these teams.
The key goal of the Centre of Excellence is to support data literacy and enable Professors and students in analytics through the resources offered under the Qlik Academic Program such as Qlik Continuous Classroom( QCC), analytics curriculum, community support etc.
This Centre would serve as a dedicated point of contact for students and also to Professors at VJIT who wish to collaborate on data analytics in areas of research and industry-academia partnerships in analytics. Professor Dr. Siddhartha Ghosh is facilitating these initiatives on behalf of VJIT.
The Centre would also serve as a point of confluence for ideas, trends and concepts in data analytics to be exchanged not just in VJIT but also for professionals, bodies and experts in analytics in the city of Hyderabad and States of Telangana and Andhra Pradesh.
A computer lab equipped with 70 hi-end computers, UPS, dedicated Server, LCD and a leased line internet connection is available to students as a part of this Centre.
More than 60 students from VJIT are already enrolled into the academic program and have begun training and accessing resources offered by the program. Many of the students dedicate a fixed time every week to train themselves using QCC. The target is to enable 180 students in analytics through the Centre every year.
Prior to the launch, 24 students participated in a hackathon conducted by VJIT and final five were selected to present their findings and demonstrate their apps built using Qlik Sense. Presentations on their apps were made on topics such as ‘The world happiness report’, ‘Analysis of students performance in pre-placement test’, ‘Hidden stories using Qlik Sense’ etc.
In addition, 20 poster presentations on various aspects of Qlik and its technologies were prepared and displayed by students at VJIT.
The Academic Program is growing at healthy pace in India and by collaborating on this initiative, engagement with Universities has moved further and the scope to work together in different activities has opened up. Also with the rapid change and introduction to newer technologies and in the world of analytics, the Centre of Excellence in Analytics is well positioned to facilitate this transition and support students and professors well.
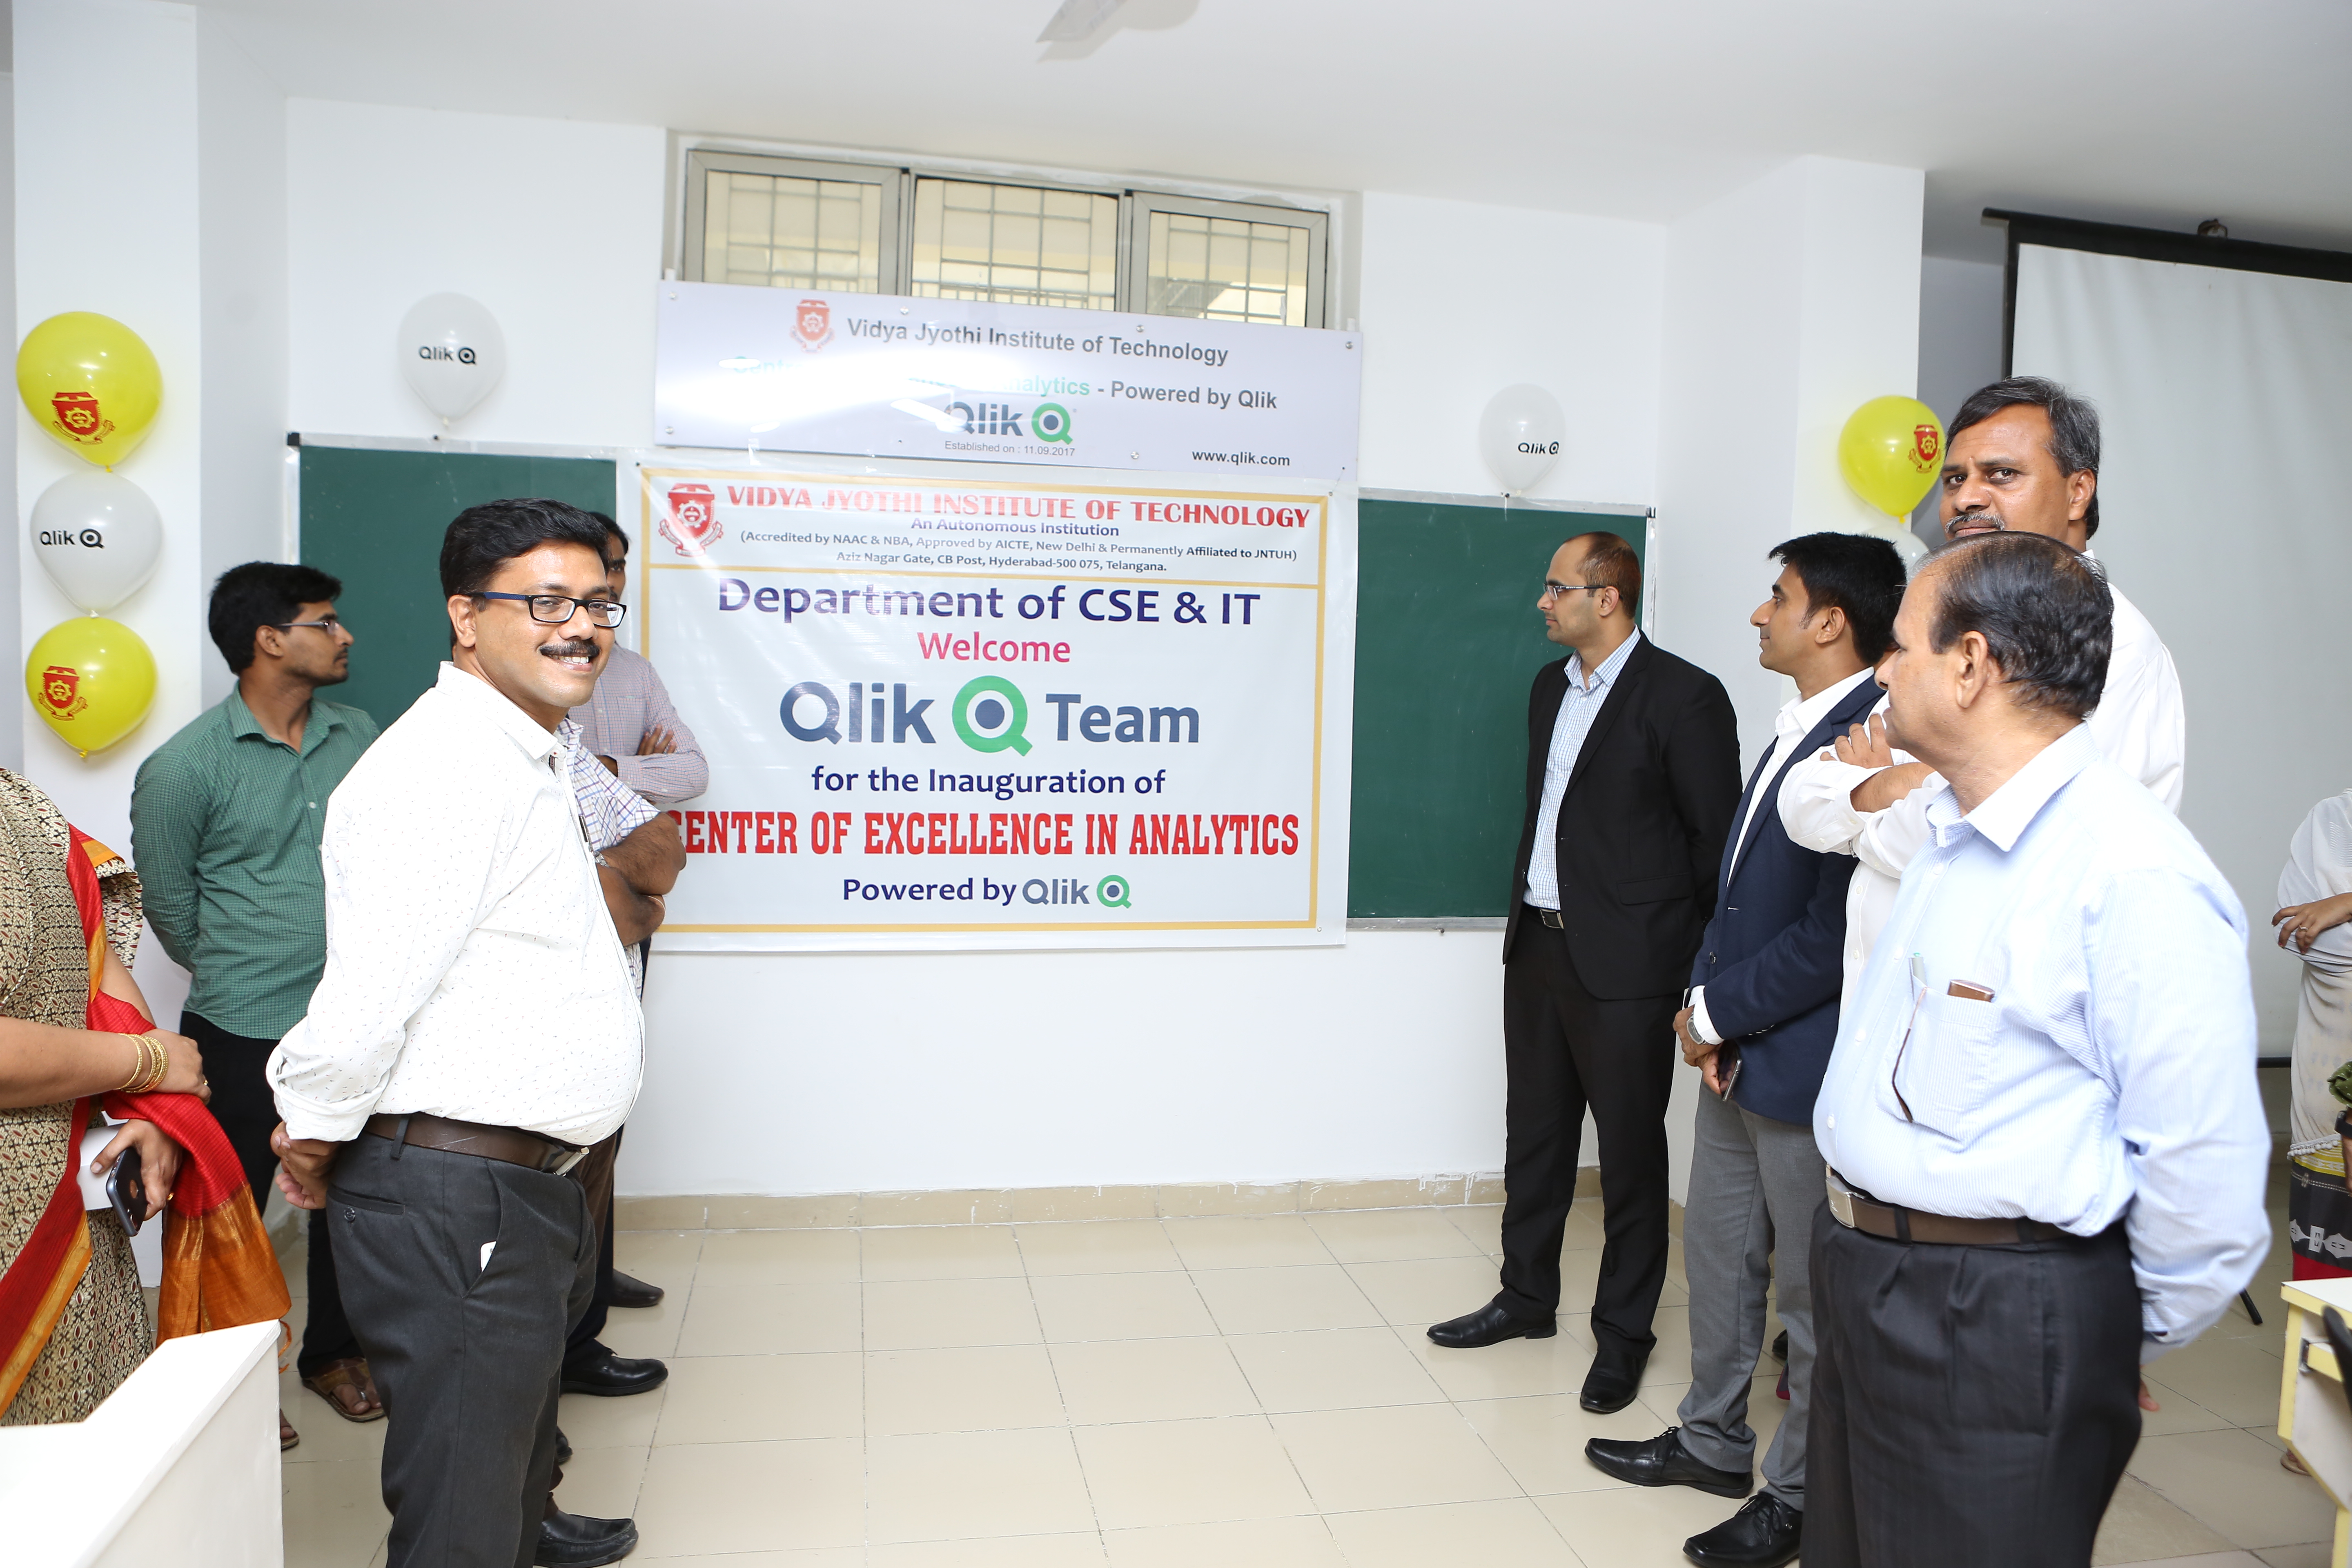
Qlik and VJIT team at the Centre of Excellence in Analytics-powered by Qlik!
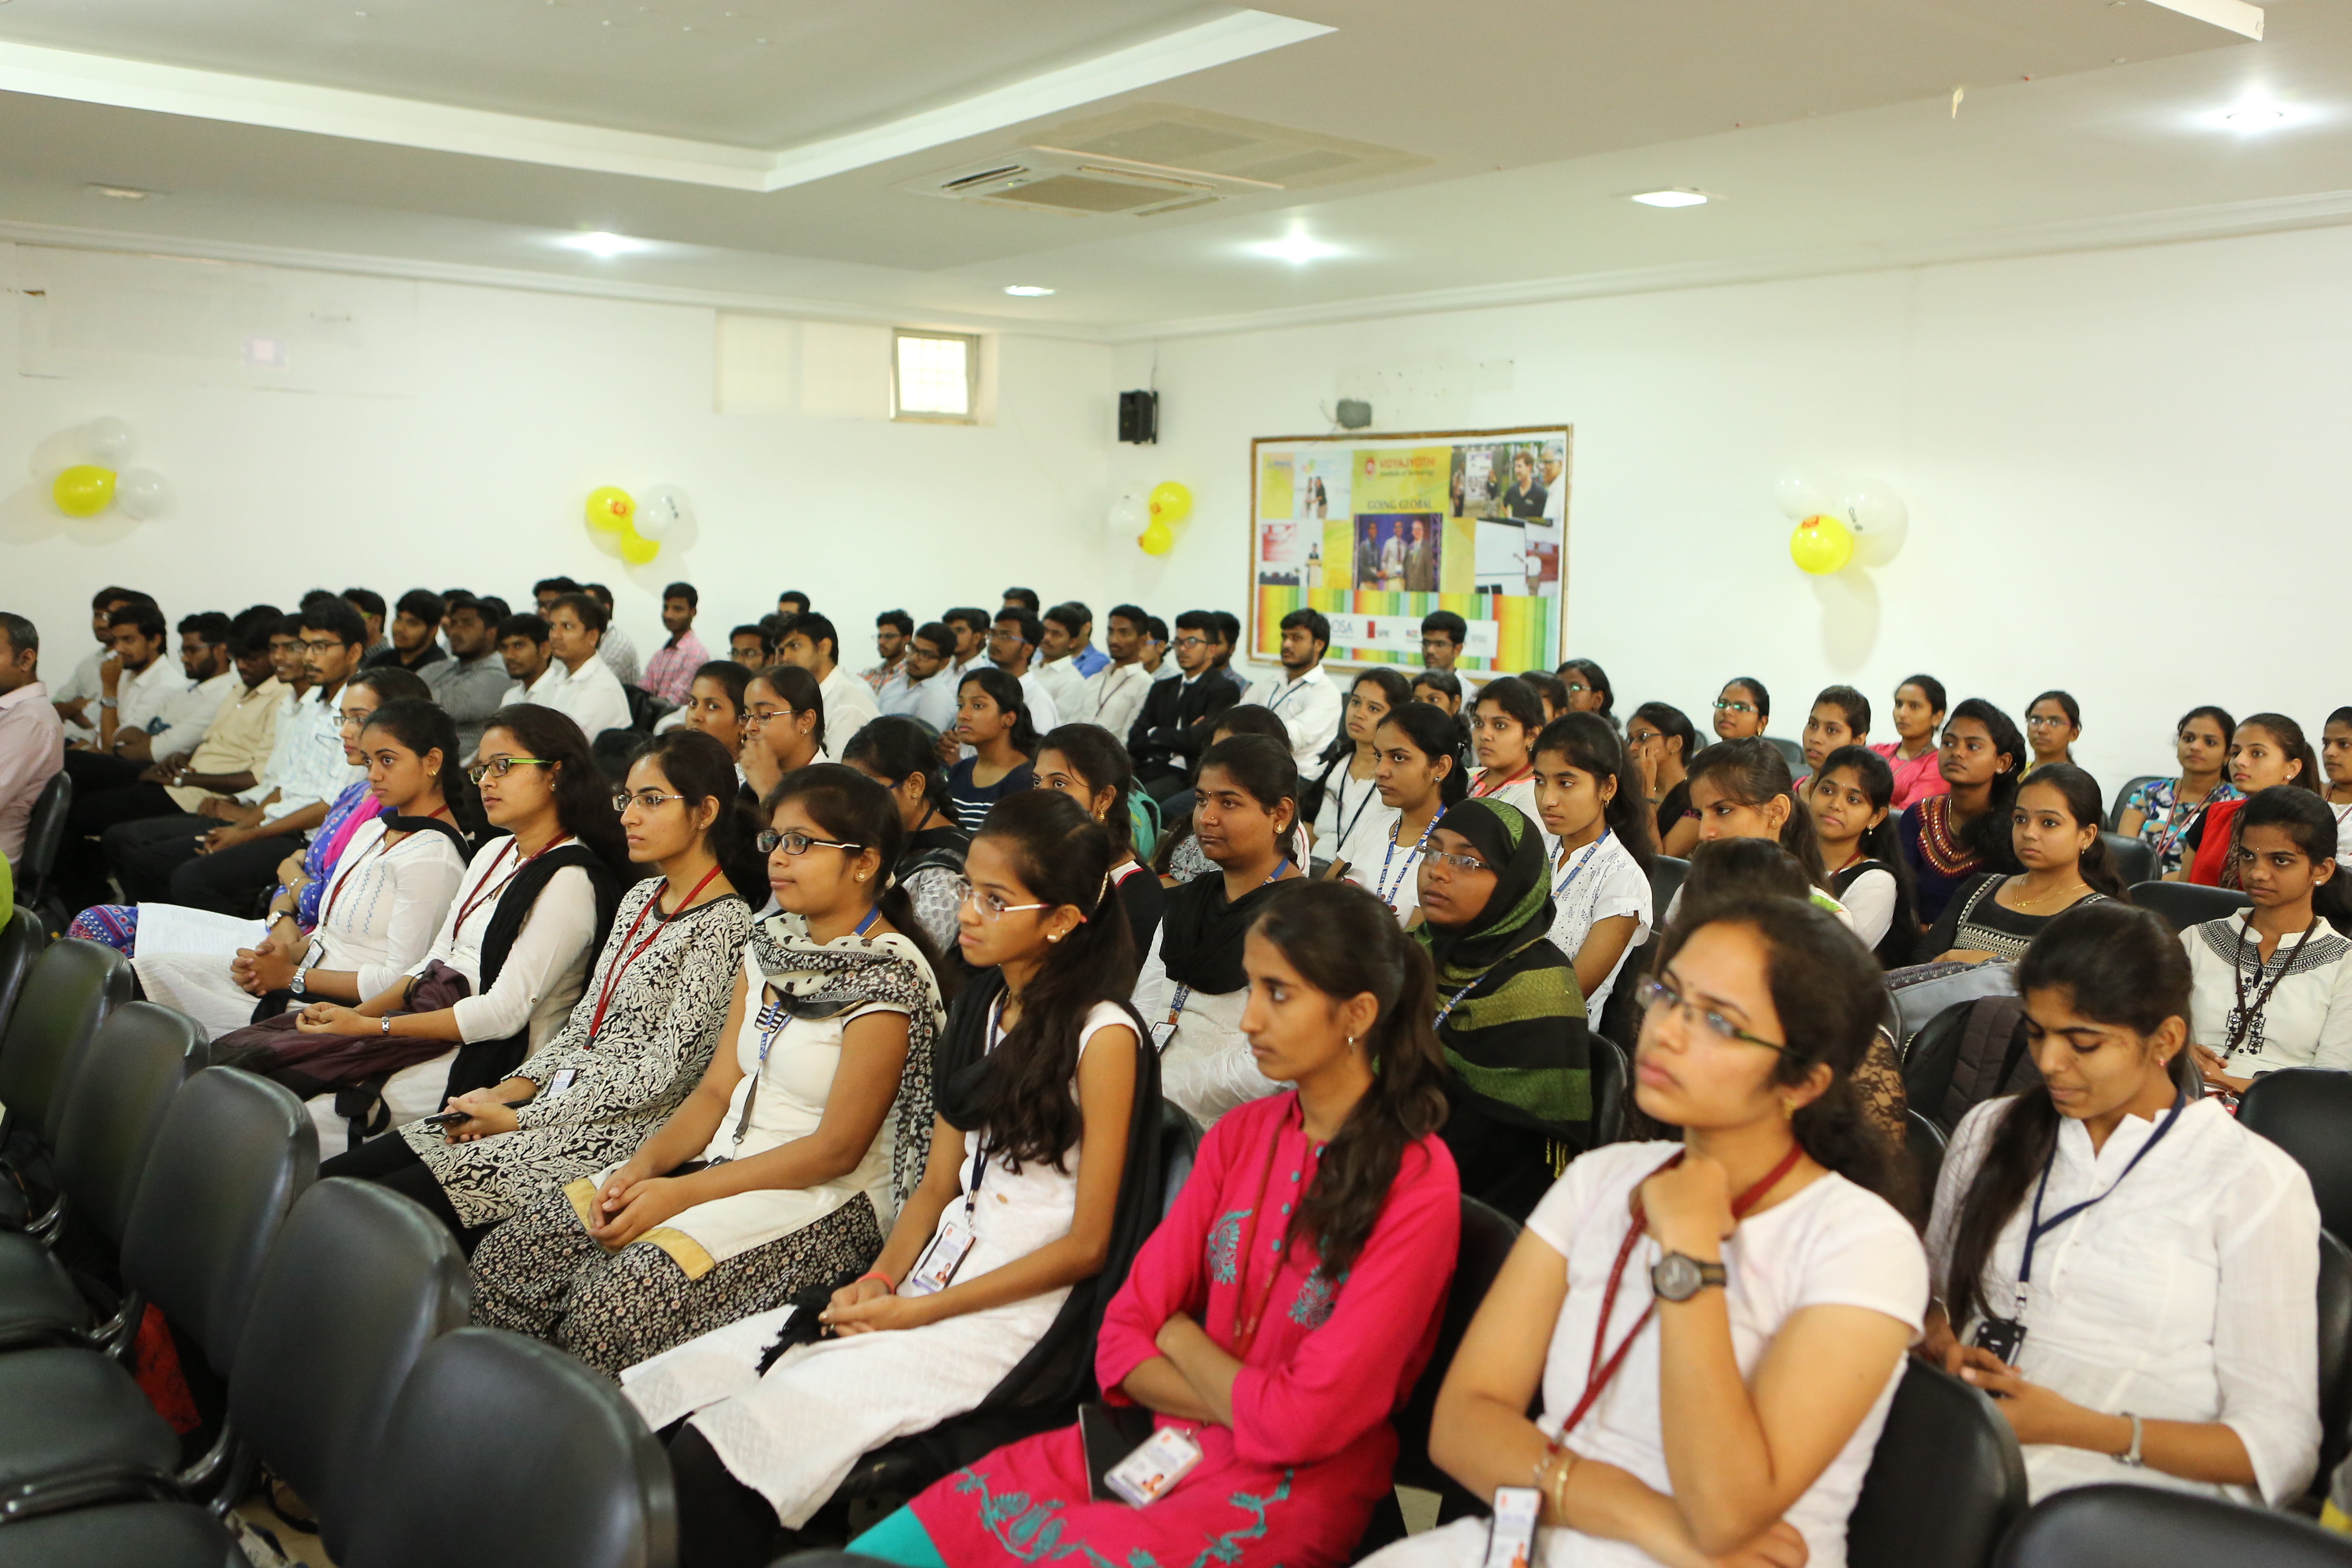
VJIT students attending the launch!
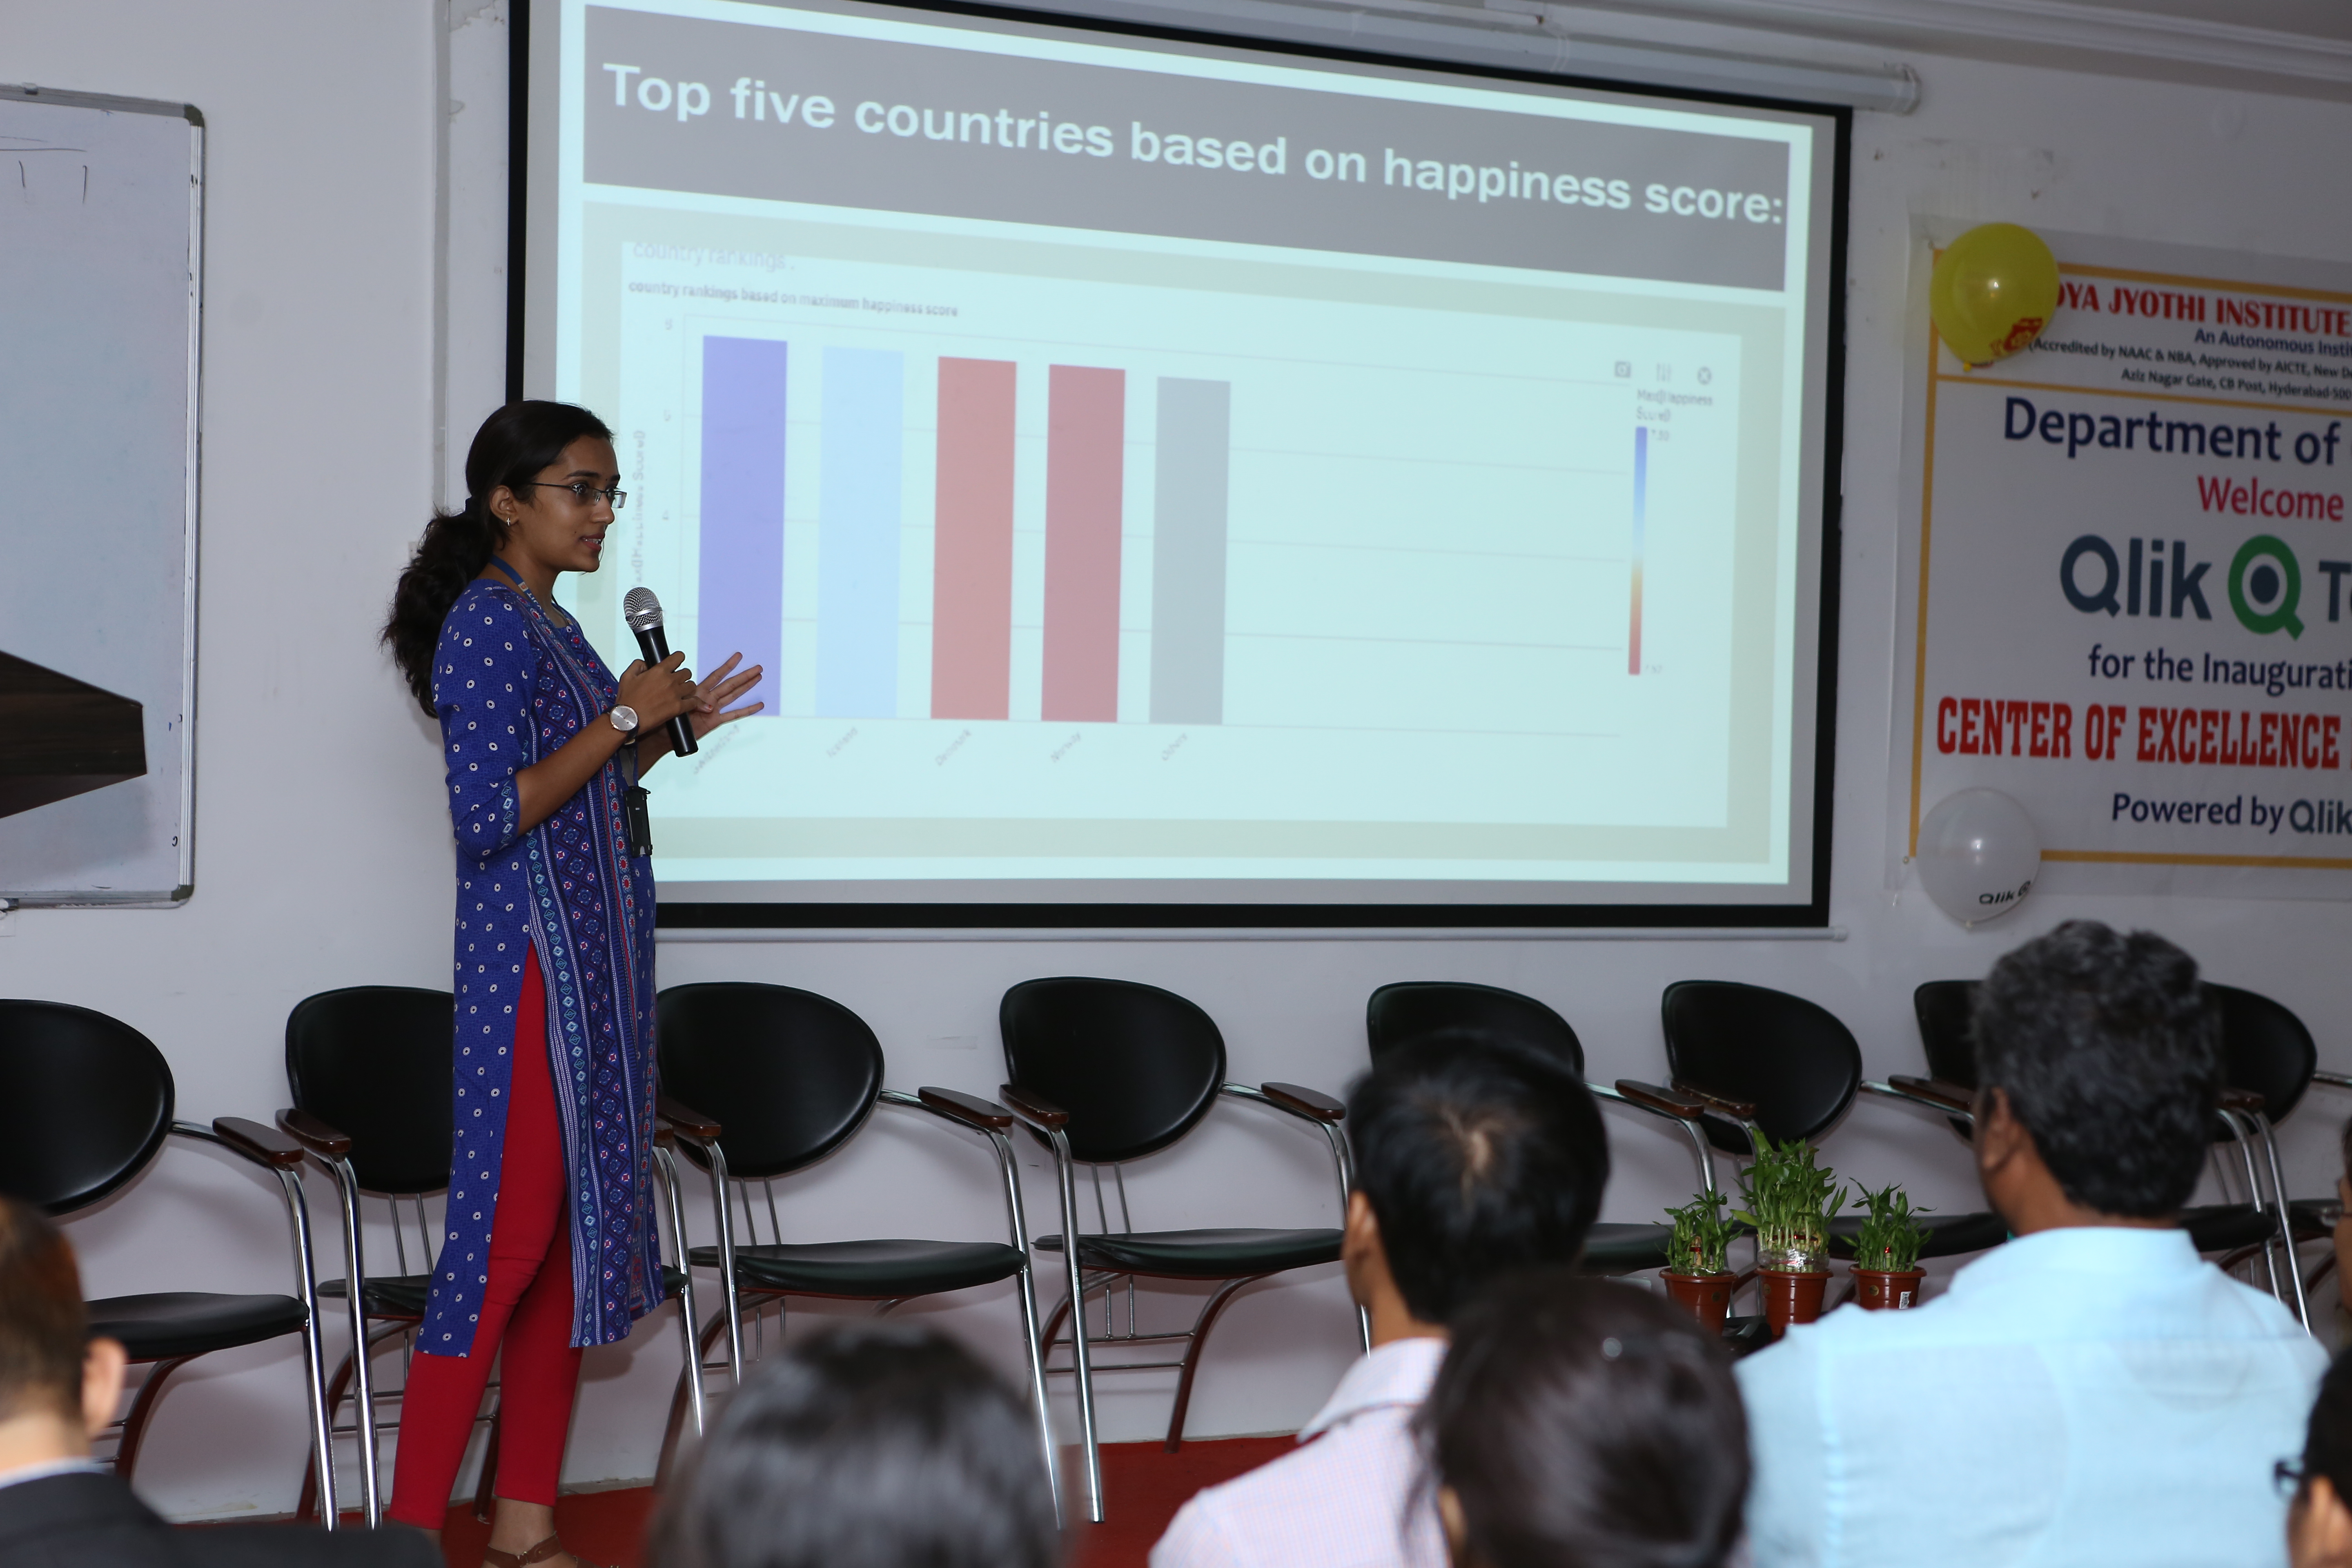
One of the students presenting her app on " The world happiness report"
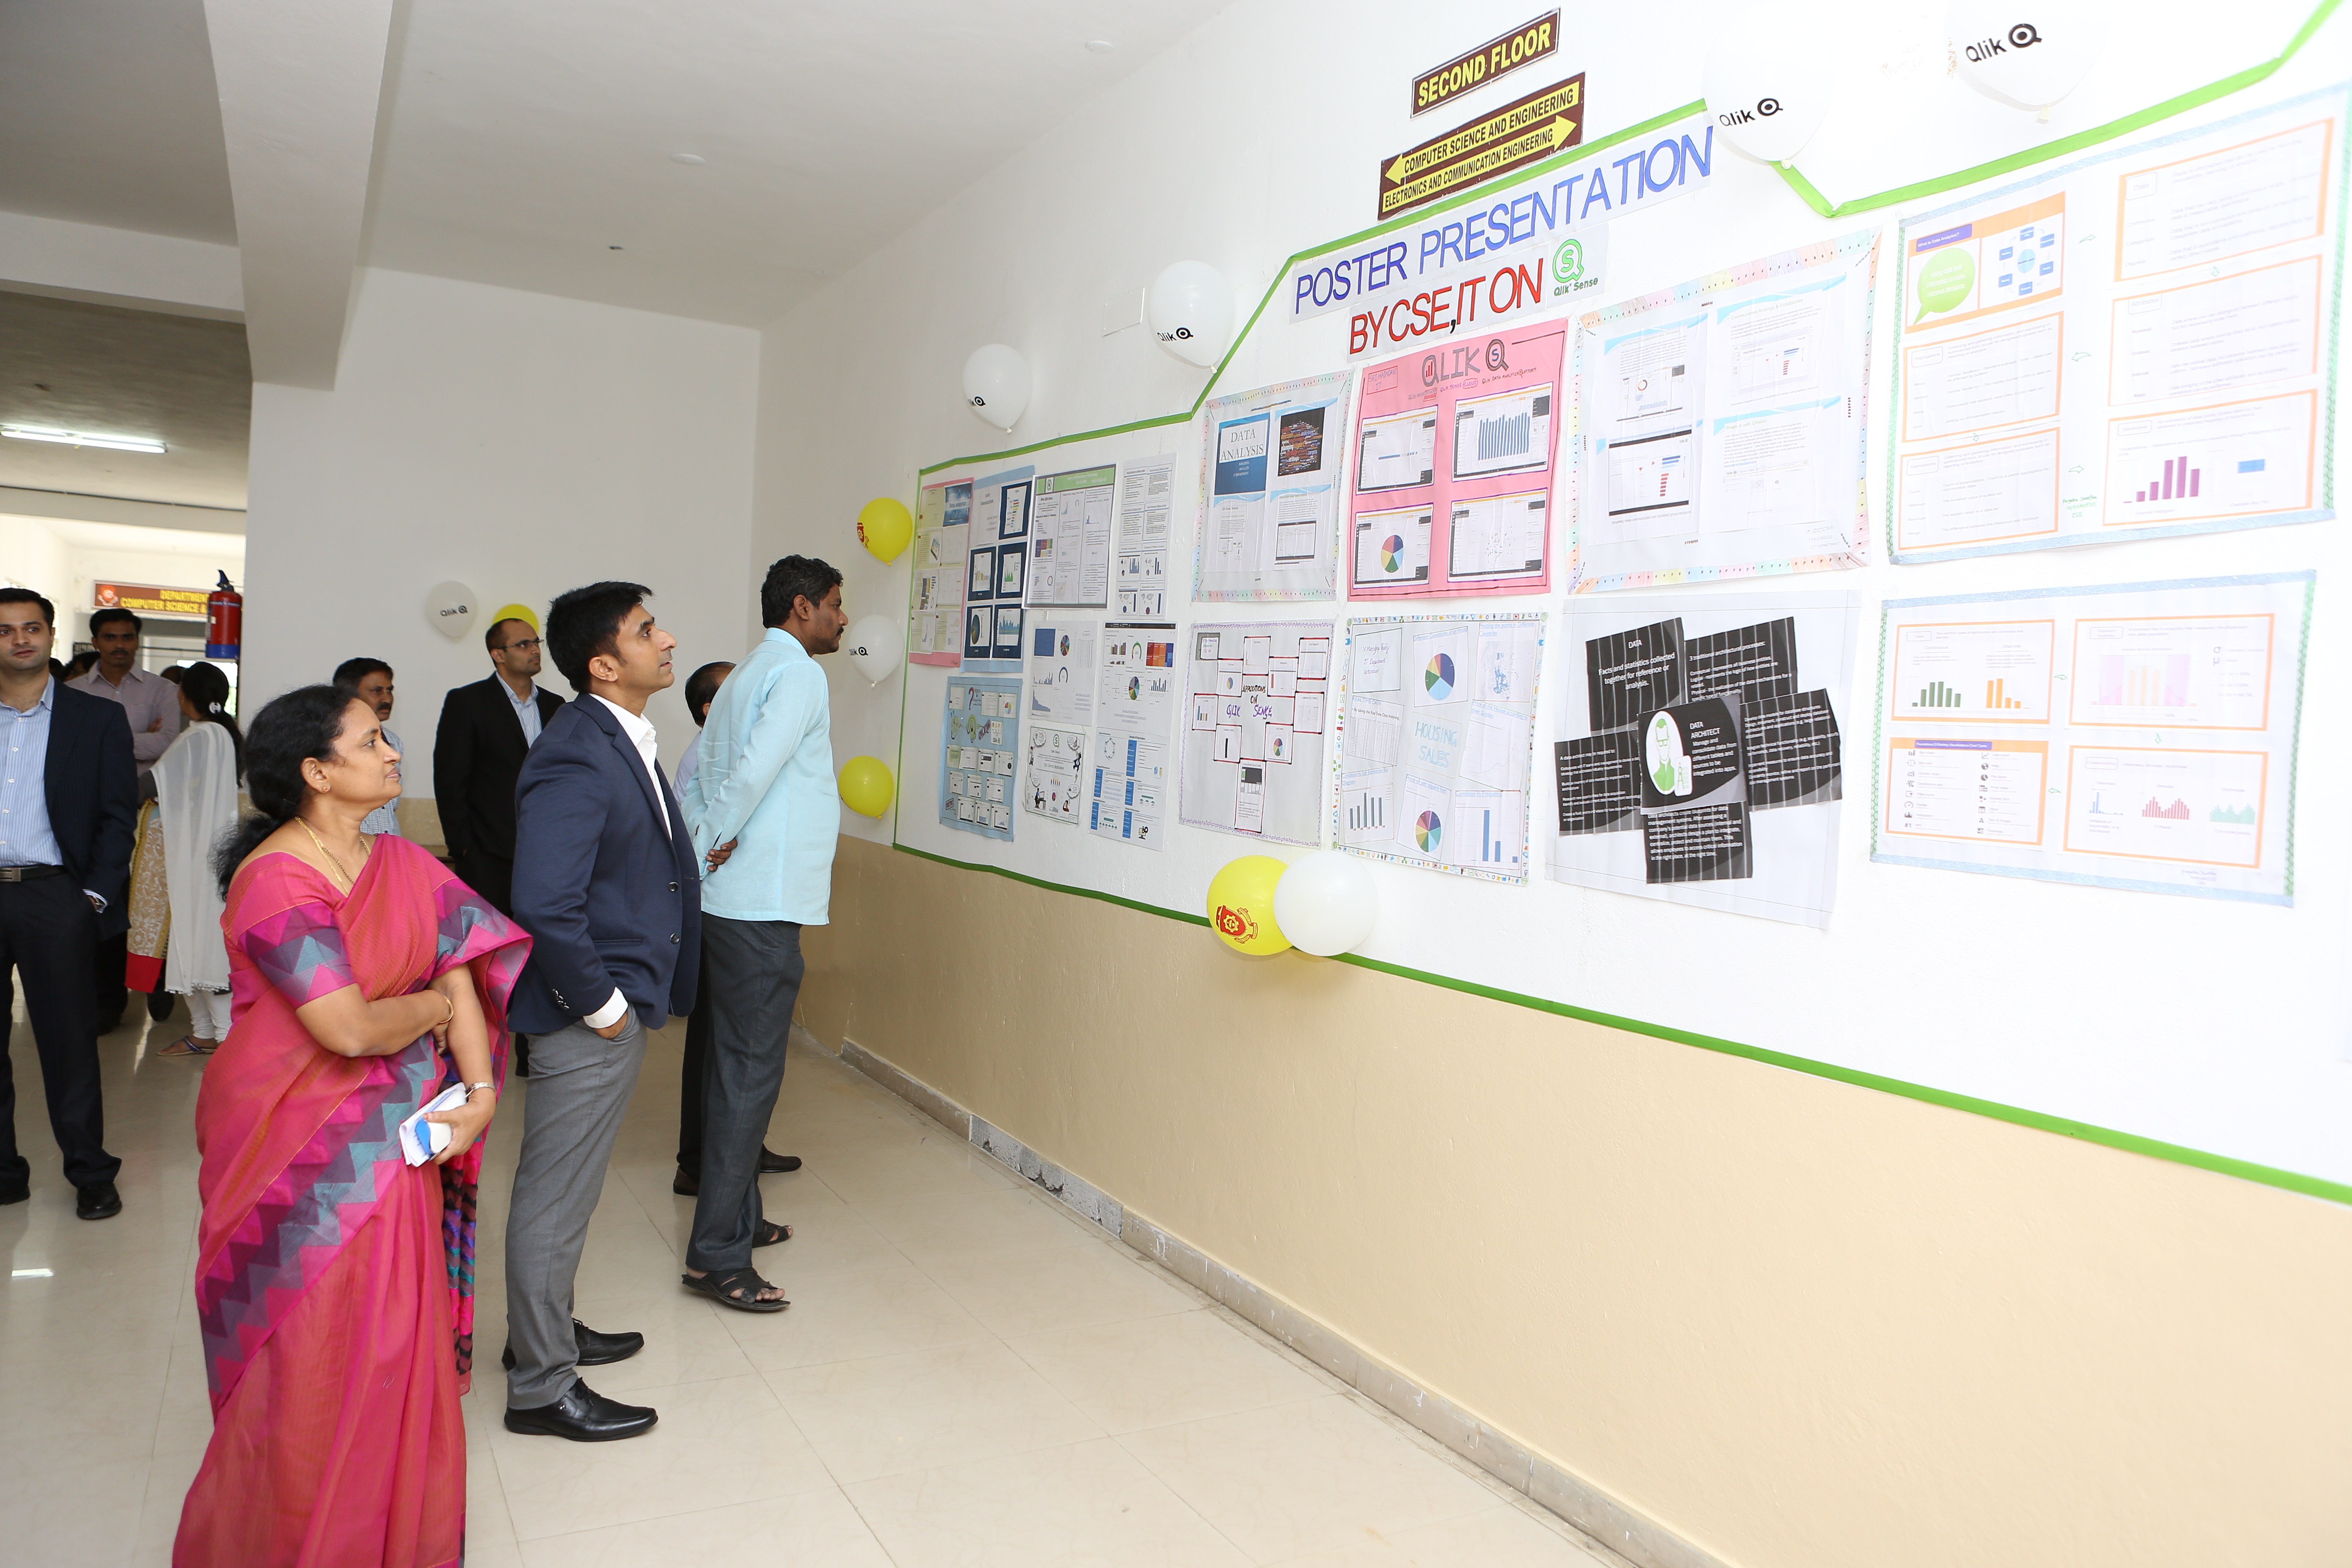
Poster presentation on Qlik by students!
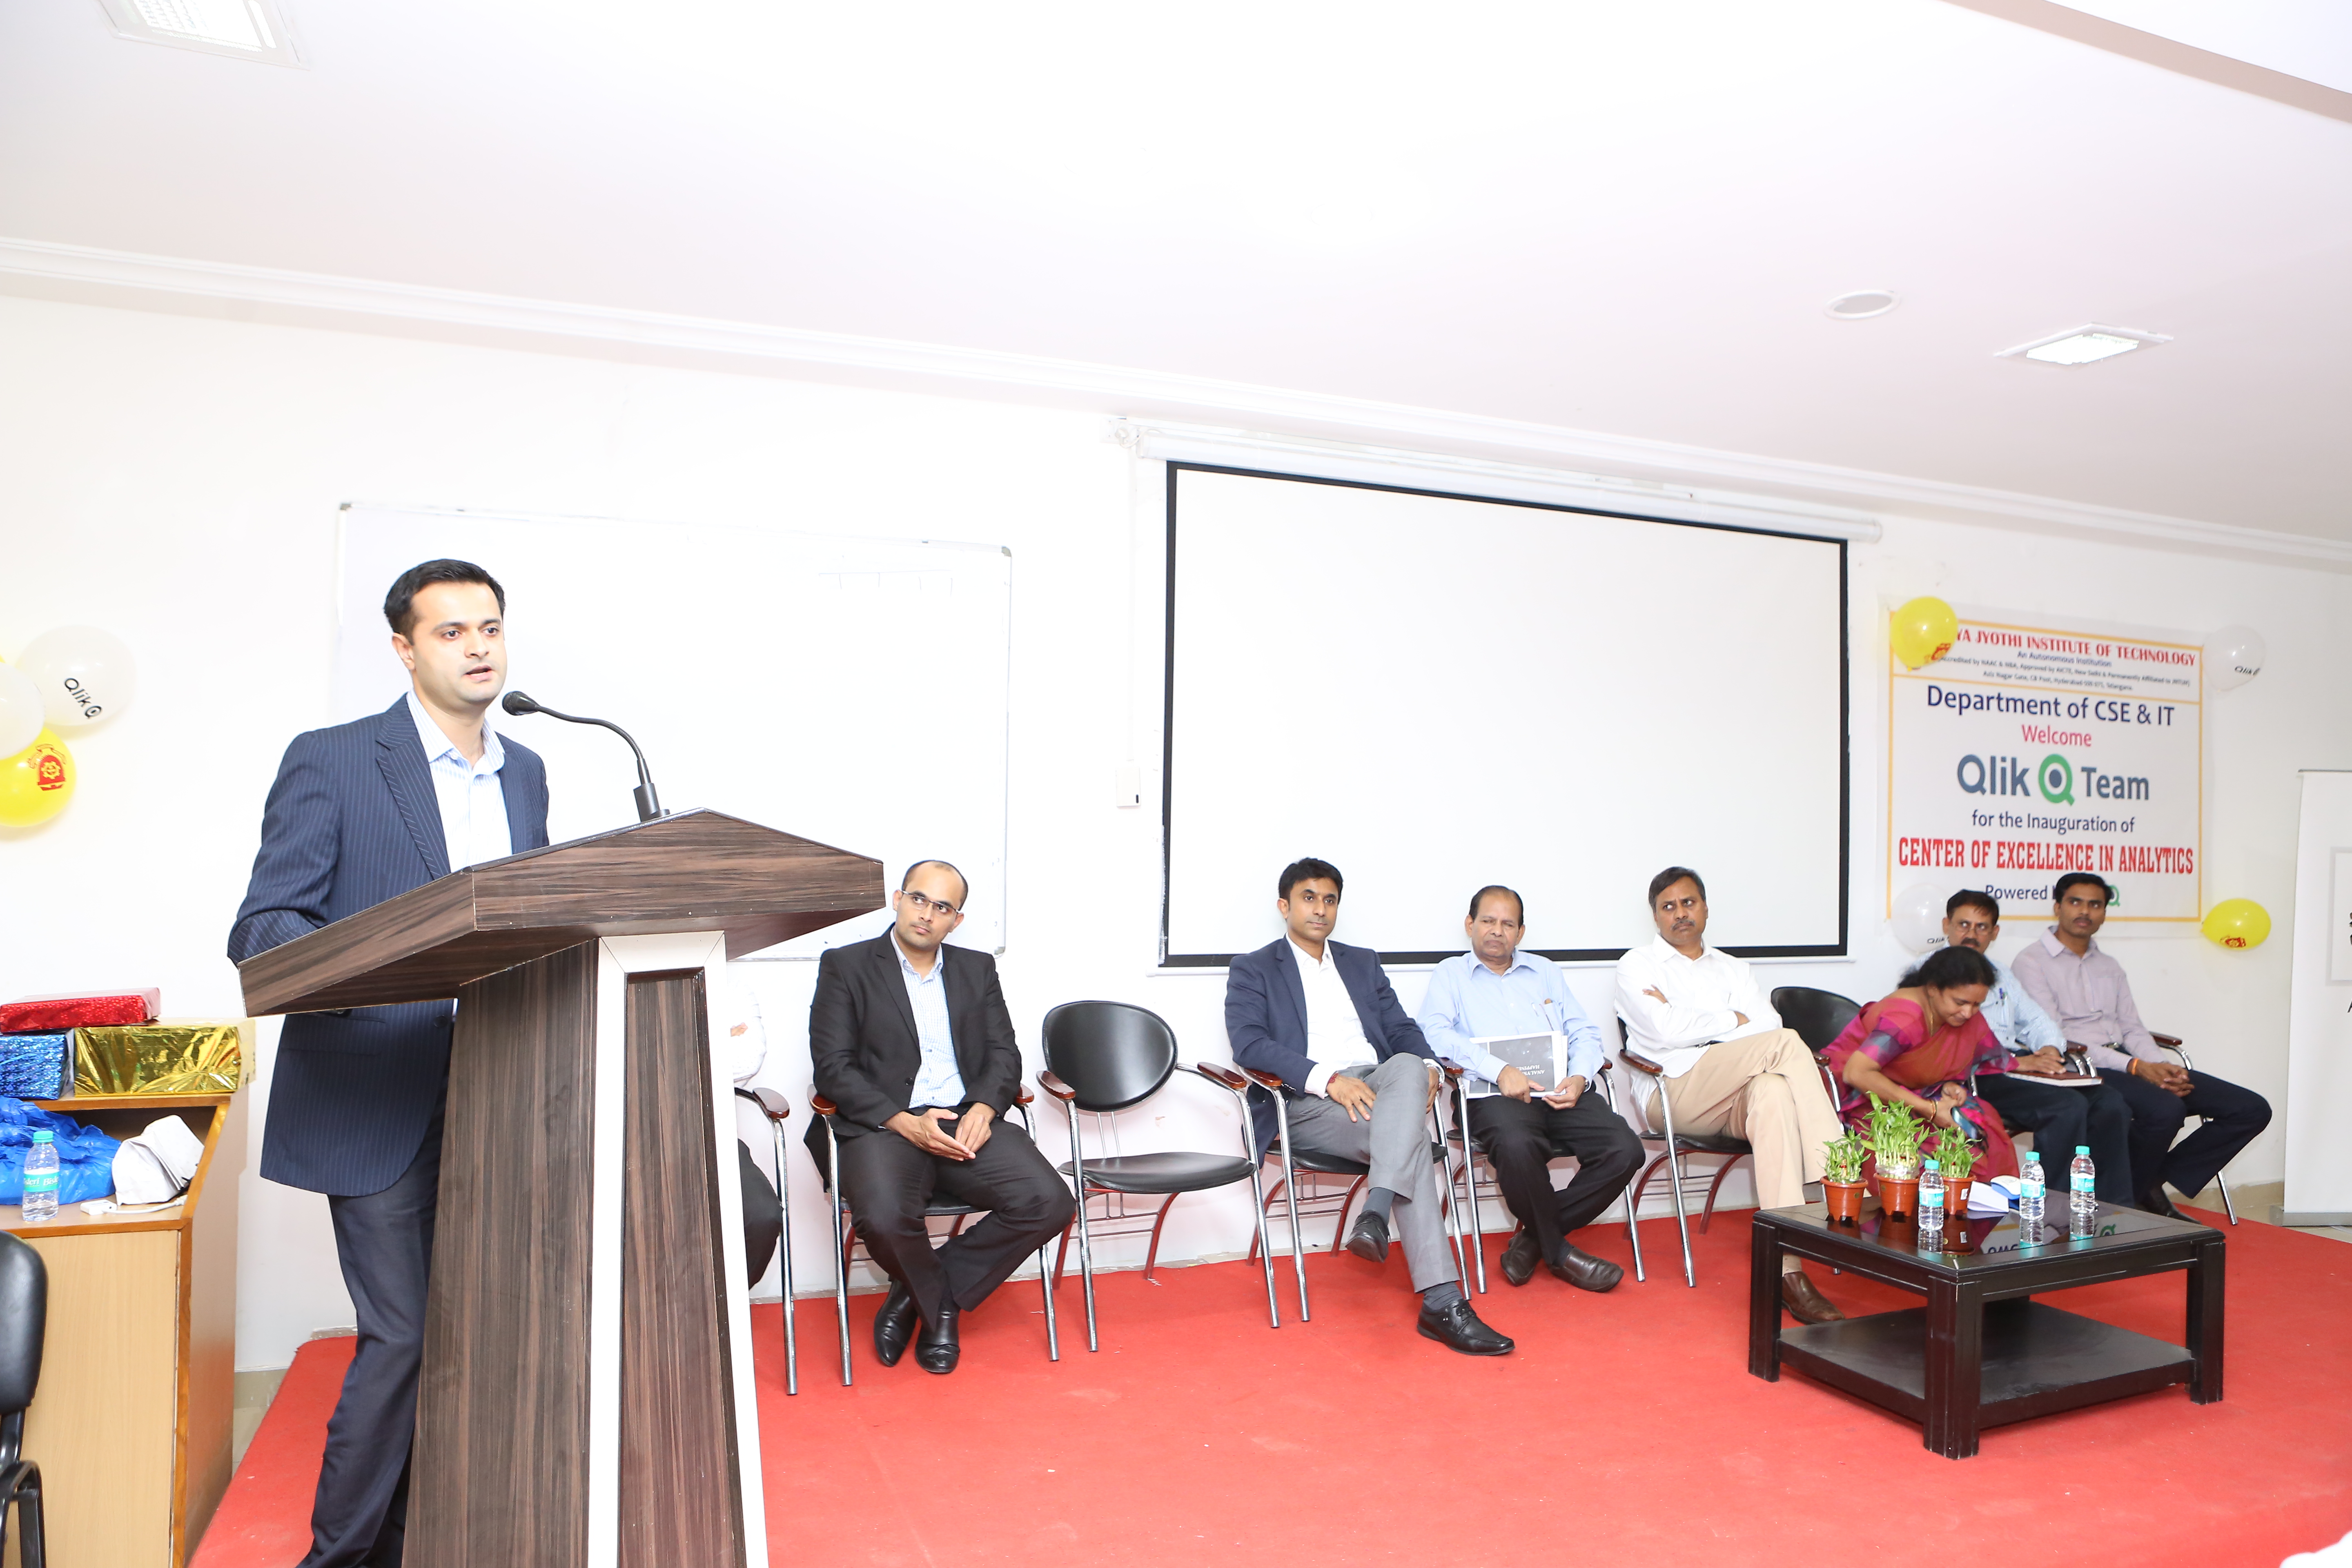
Marketing Manager-India and SAARC Jaydeep Deshpande addressing the audience
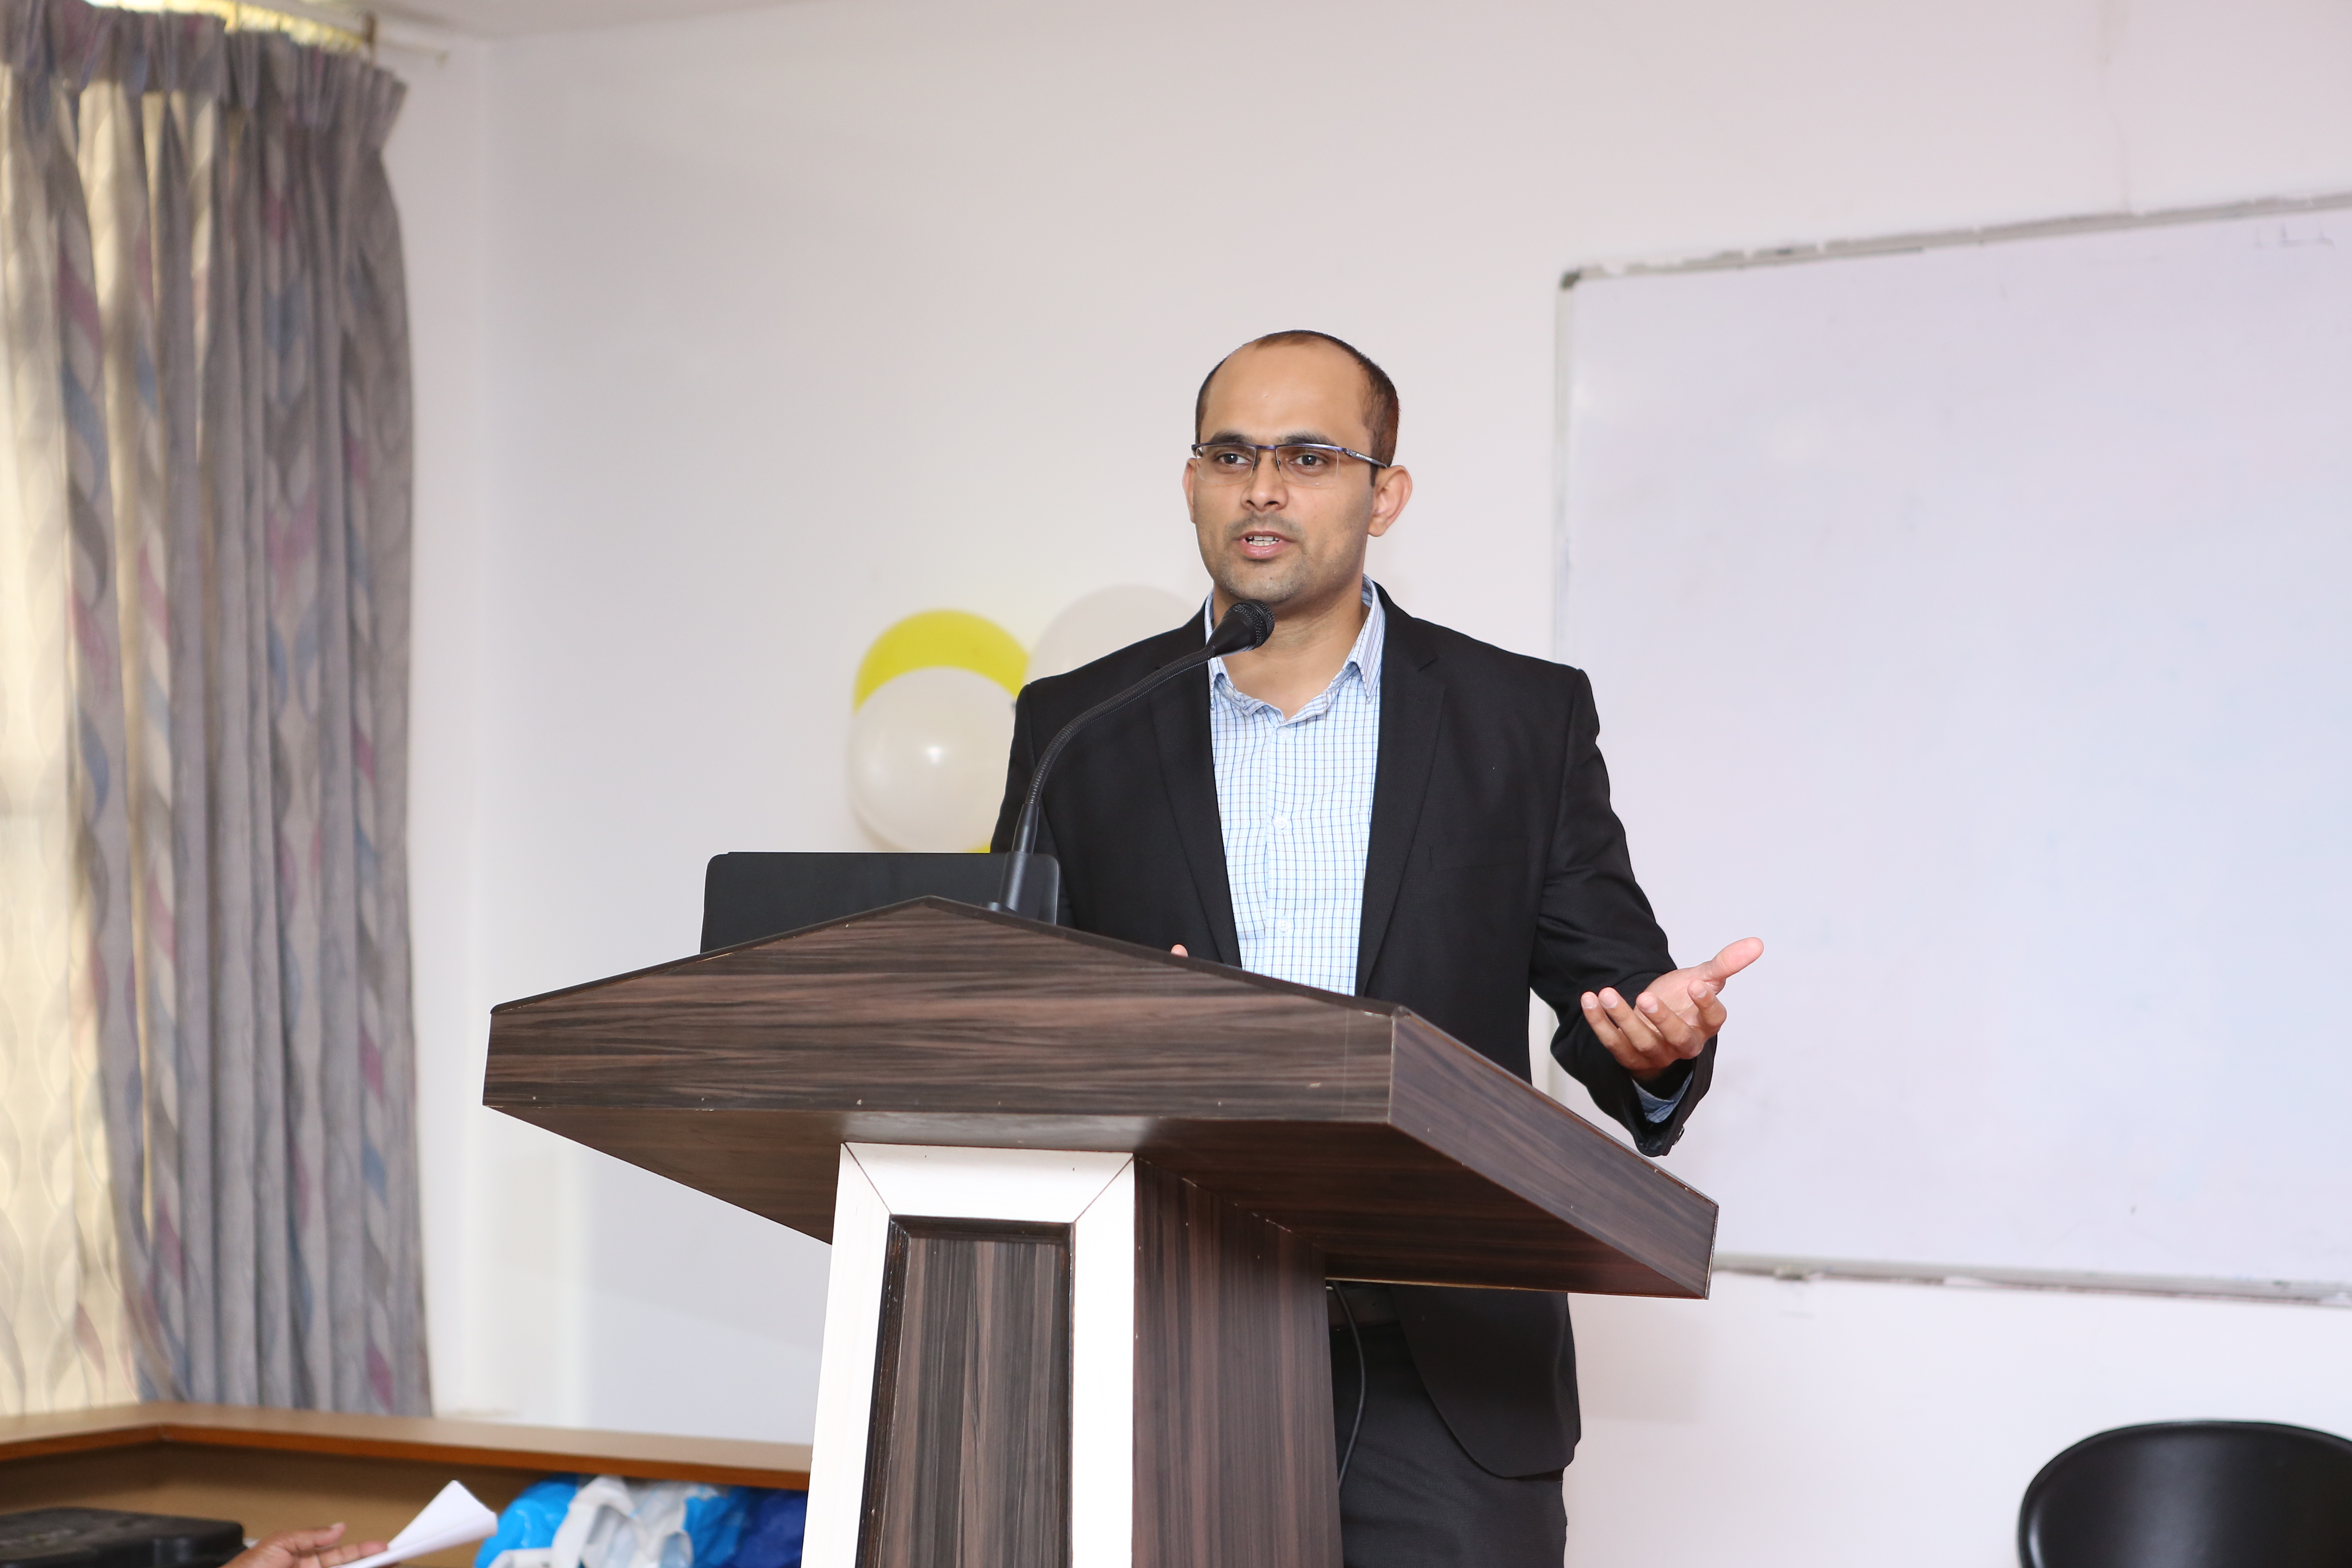
Solution Architect and Regional Champion of the Academic Program, Fahad Khan doing a demo on Qlik Sense
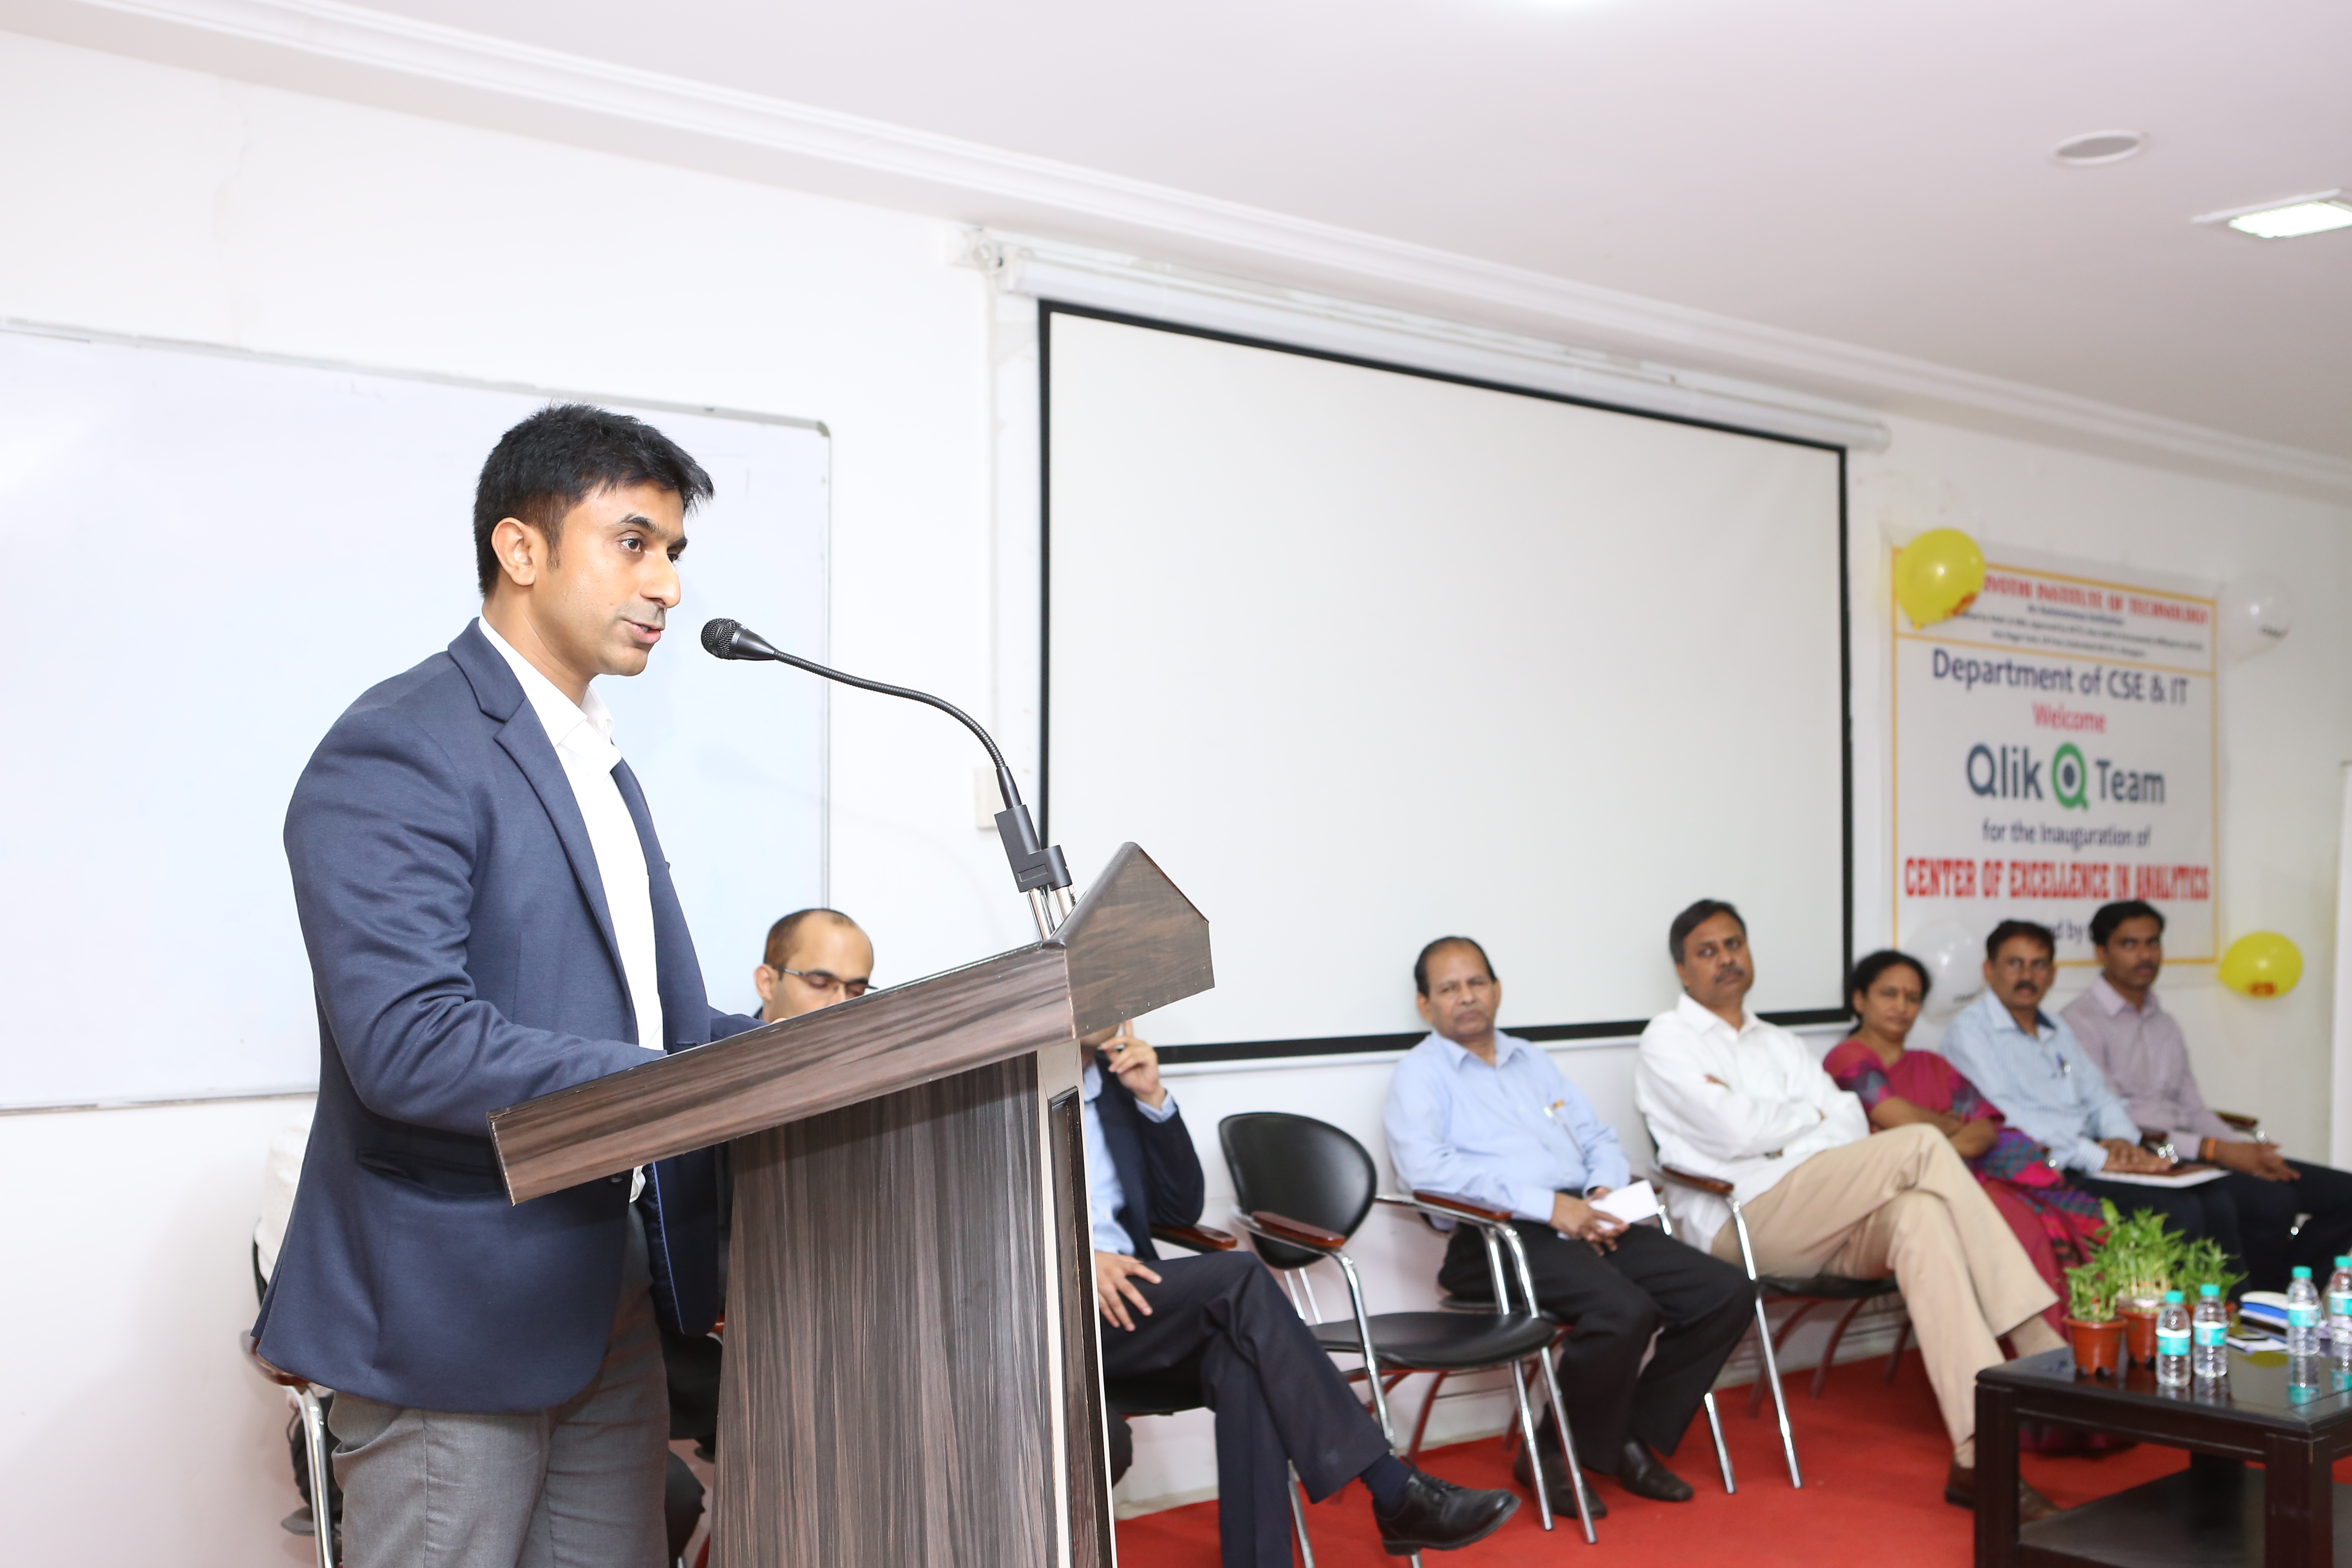
Academic Program Manager APAC, Pankaj Muthe speaking during the inauguration
One of the student shares her experience about the Academic Program and how she's benefitted using the resources available under the program.
-
It's Not What You Know, It's What You Can Do
A new blog post is available! In this blog we discuss the need for organizations to innovate and evolve their approach to learning and enablement. R... Show More
A new blog post is available! In this blog we discuss the need for organizations to innovate and evolve their approach to learning and enablement. Rather than just checking a box once learning has been completed, organizations must ensure their employees can apply the competencies and skills they learned. And at Qlik, we emphasize not just seat-time but mastery of skills.
To read the full post visit It's Not What You Know, It's What You Can Do | Qlik