Announcements
Join us at Qlik Connect for 3 magical days of learning, networking,and inspiration! REGISTER TODAY and save!
hic
Former Employee
Former Employee


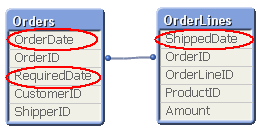
A common situation when loading data into a Qlik document is that the data model contains several dates. For instance, in order data you often have one order date, one required date and one shipped date.
 

Base model.png


This means that one single order can have multiple dates; in my example one OrderDate, one RequiredDate and several ShippedDates - if the order is split into several shipments:


Logic 1.png


So, how would you link a master calendar to this?


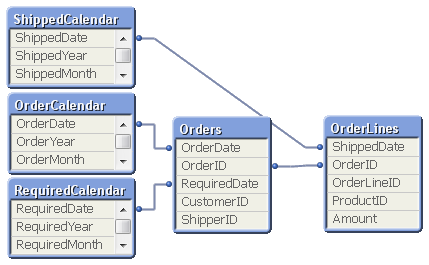
Well, the question is incorrectly posed. You should not use one single master calendar for this. You should use several. You should create three master calendars.


The reason is that the different dates are indeed different attributes, and you don’t want to treat them as the same date. By creating several master calendars, you will enable your users to make advanced selections like “orders placed in April but delivered in June”. See more on Why You sometimes should Load a Master Table several times.


Your data model will then look like this:
 

Model with spec calendars.png


But several different master calendars will not solve all problems. You can for instance not plot ordered amount and shipped amount in the same graph using a common time axis. For this you need a date that can represent all three dates – you need a Canonical Date. This is how you create it:


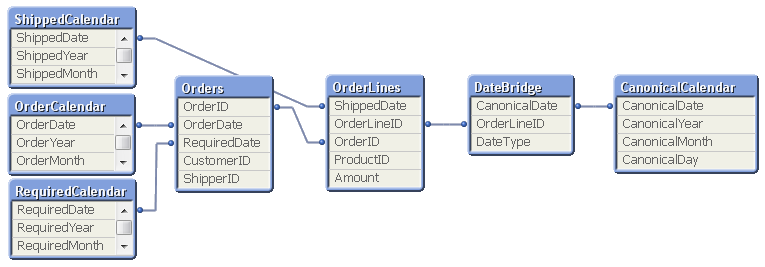
First you must find a table with a grain fine enough; a table where each record only has one value of each date type associated. In my example this would be the OrderLines table, since a specific order line uniquely defines all three dates. Compare this with the Orders table, where a specific order uniquely defines OrderDate and RequiredDate, but still can have several values in ShippedDate. The Orders table does not have a grain fine enough.


This table should link to a new table – a Date bridge – that lists all possible dates for each key value, i.e. a specific OrderLineID has three different canonical dates associated with it. Finally, you create a master calendar for the canonical date field.
 

Full model.png


You may need to use ApplyMap() to create this table, e.g. using the following script:


     DateBridge:
     Load
          OrderLineID,
          Applymap('OrderID2OrderDate',OrderID,Null()) as CanonicalDate,
          'Order' as DateType
          Resident OrderLines;

     Load
          OrderLineID,
          Applymap('OrderID2RequiredDate',OrderID,Null()) as CanonicalDate,
          'Required' as DateType
          Resident OrderLines;

     Load
          OrderLineID,
          ShippedDate as CanonicalDate,
          'Shipped' as DateType
          Resident OrderLines;


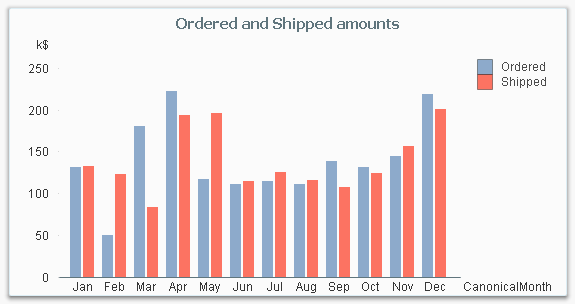
If you now want to make a chart comparing ordered and shipped amounts, all you need to do is to create it using a canonical calendar field as dimension, and two expressions that contain Set Analysis expressions:


     Sum( {$<DateType={'Order'}>} Amount )
     Sum( {$<DateType={'Shipped'}>} Amount )
 

Bar chart.png


The canonical calendar fields are excellent to use as dimensions in charts, but are somewhat confusing when used for selections. For this, the fields from the standard calendars are often better.


Summary:

  • Create a master calendar for each date. Use these for list boxes and selections.
  • Create a canonical date with a canonical calendar. Use these fields as dimension in charts.
  • Use the DateType field in a Set Expression in the charts.


A good alternative description of the same problem can be found here. Thank you, Rob, for inspiration and good discussions.


HIC

192 Comments
dberkesacn
Partner - Creator III
0 Likes
1,613 Views
bvssudhakar
Creator III
Creator III

Hi hic

Can you also please check for this... issue is about Canonical Date

Re: Master Calendar "Field not found" Error

0 Likes
1,613 Views
qliklizzy
Creator II
Creator II

Hi

I have read these posts on canonical date/ date bridges -  due to my task of getting some data together in an APP but I'm not sure if this is what I need; I definitely cant get it work but its a bit more confusing than dates attached to the one ID, I suppose I want to discount the dates in one table when my week commencing begins in the other...

I have a theatre data set, that runs hourly showing past & future activity booked into theatre slots, I was using the futures dates for PLANNED, and I now want to bring in historic activity (which I was going to use the same dataset however these are based on OPDATE not discharged) so I am bringing an inpatient table with discharged date as ACTUAL.

Two different datasets:  I want to show a table count at whatever time in the month selected, by week commencing i.e.. for January as of now - I have 3 weeks of actual from 31/12/18, and 2 weeks left of planned 21/1, 28/1 - so I am able to work out how far they are away from baseline activity in month based on what's actually happened so far and what's left booked in.? - I have this in a spreadsheet very manual, I just know it could go into QlivKiew and be way more useful, less time consuming to produce and more live with all the cancelled slots we have being refreshed.

 31-Dec07-Jan14-Jan21-Jan28-Jan   
DaycaseACTACTACTPLPLSum JanTarget JanVariance
Breast Surgery533722030-10
Endoscopy10118315921313679270092
ENT62532282511610016
Colorectal Surgery092031477
General Surgery1623151247092-22
Upper Gastrointestinal Surgery01130523
Vascular Surgery23512426233
Gynaecology18242681086110-24
Paediatrics274001315-2
Ophthalmology417183494428826622
Oral Surgery622283115102138-36
Pain Management20162018074114-40
Plastic Surgery3451574726215233-18
Trauma & Orthopaedics830253019112124-12
Urology53921261034441837543
Total3125605865613322351232922

But how do I get to show this in one table without duplicating - I haven't got that fine grain table described earlier which is where I think I'm going wrong? OR do I need this if I want one dataset shown only when the week has passed - but I still need to join them up using dates.

sorry I'm very confused.


Thanks

Liz


0 Likes
1,583 Views
Samir
Contributor
Contributor

Hello Hic,

I have four tables with different date fields; MT_Planned_Completion in Milestone Table, DT_Forecast_Date in Design Table, CT_Forecast_Date in Construction Table and AE_Forecast_Table in Account Expense Table.

I am trying to use your method to create a single date dimension. Your article mentions picking a table with grain fine enough to create  date bridge table. I am not sure which table to pick on my case, because the Project_ID is the only common link between the tables and it doesn't necessarily defines the date fields uniquely.

Please advise how I should proceed.

Thanks

Samir

Canonical.JPG

1,457 Views
Dan_54S
Contributor II
Contributor II

Like others here, I am having an issue where I don't have a field with fine enough grain that it relates to just one date in the two separate calendars I am trying to join. In my case, I am trying to link order date and view date by product id. My canonical calendar is only showing one date for each product id (the 1st possible date), rather than all relevant dates. It seems to me there should be away to create a DateBridge table with each product id listed multiple times so that there is a row for each product id and date combination. This would solve the issue with granularity-is it not possible? 

0 Likes
1,249 Views
robert99
Specialist III
Specialist III

Hi Dan.

1. You just need to use a joined TABLE with the finer grain. So if you have a separate 'sales invoice header' table (one row per invoice number) joined (by invoice number) to a 'sales invoice line' (many rows per invoice) table you must join to the 'sales invoice line'  table (the finer grain). Not the 'sales invoice header' table. 

2. You can join to the link table using a created unique row number. Like eg >>>  'link' & '/' & rowno() as rowname.

3. Sometimes I concatenate tables (rather than join or join keep) to get the desired result. For example I would never concatenate the invoice header and invoice lines tables but might invoice lines and invoice deliveries. As in this example

CanonDate.JPG


0 Likes
1,238 Views
ben_skerrett
Contributor III
Contributor III

Hi Henric,

Thank you for the excellent post. As a Newbie to Qlik I am trying to following the logic but i am seeing a lot of duplicated values in my pivot table (see attachment). Will your Canonical Calendar work for the following scenario please?

I am creating a scorecard to review the performance of our vendors (each vendor has a unique number).

Currently I have three tables, all of which have a common field 'Vendor' number.

The first Table: Sums the number of delivered items by Goods Receipt Date (MB51 - ReportDate)

The Second Table:  Counts the number of non-conformances by Date Raised = (QM10 - ReportDate)

The Third Table: Sums the cost of Non-conformances by Posting Date = (ZNOTIF - ReportDate)

As per the attachment, I would like to plot each of the three measures, by vendor, against the same YearMonth time line but i am seeing a lot of duplicated values.

Pic1.pngPic2.png

Thanks

Ben

0 Likes
1,171 Views
robert99
Specialist III
Specialist III

Hi Ben

It won't work the way you have done this. as the data bridge table needs a one to one relationship. Not a one to many. (because the way you have set this up vendor may have more than one date. So how can the link table link to the appropriate date?)

What I would do in this situation is concatenate the three tables. with one common date. So then you then will not need a canonical date

Give a common name to the three tables. Say 'znotif' as TableName , etc and then use this as required in set analysis.

Hope this helps

0 Likes
1,145 Views
ben_skerrett
Contributor III
Contributor III

Thanks Robert, I will look into this.

0 Likes
1,134 Views
robert99
Specialist III
Specialist III

Another option (this might work - you would need to try it) would  to have a unique row number in each table  >> znotif & rowno() and use this to join to the Data Bridge

It depends on circumstances though. I try to keep a model simple and often concatenation is the best way. But not always

0 Likes
1,088 Views