Announcements
Join us at Qlik Connect for 3 magical days of learning, networking,and inspiration! REGISTER TODAY and save!
hic
Former Employee
Former Employee

Hierarchies are very common in all database and business intelligence solutions. Usually they are balanced and with a fix number of levels, and then they do not pose any problems. Just load the data, add a drill-down group, and you’re done.
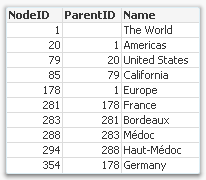

Adjacent Notes source 2.png

But there is one type of hierarchy that is somewhat tricky to get right – an unbalanced, n-level hierarchy. Typical for this type of hierarchy is that the levels are not named, and you really don’t know on which level you need to search for a specific node.


Usually such a hierarchy is stored in an Adjacent Nodes table, i.e. a table that has one record per node and each node has a reference to its parent.


Such a table can be loaded into QlikView directly using the Hierarchy prefix. This prefix will transform the Adjacent Nodes table into an Expanded Nodes table that has additional fields that you can use in your app.
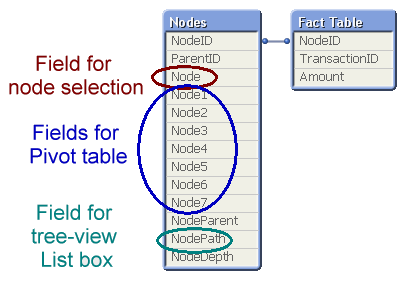
 

Data model single table - BP.png


With the fields in this table, you can easily create a pivot table and a tree-view list box. Below you can see some wine districts displayed in both these object types:
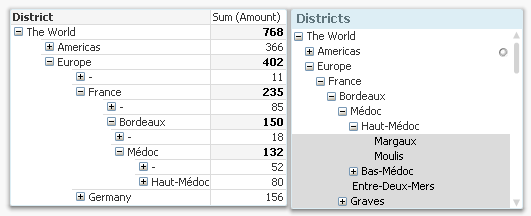
 

Tables - BP.png


One challenge with hierarchies is that you can refer to a node in two different ways: Either to the node including the entire sub-tree, or to the node only, excluding all sub-nodes. In the example with the wine districts, it would mean any wine from Bordeaux, and unspecified Bordeaux, respectively. In the pivot table above, the difference is obvious: Any wine from Bordeaux sums up to 150 units, and the unspecified Bordeaux sums up to 18 units.


A user usually wants to make selections referring to the entire sub-tree, but the above solution does not have any field for this. To create such a field, you need the second hierarchy-resolving prefix – the HierarchyBelongsTo.


This prefix will also transform the hierarchy table. The result will be a table containing one record per descendant-ancestor pair. In other words, the ancestor (tree ID) will link to all its descendants (node ID), and can thus be used to make selections of entire sub-trees. (The “TreeBridge” table in the picture below.)


But it doesn’t stop here… The above solution creates one field in which tree searches can be made, but in order to create a drill-down for trees, you need an additional table – an expanded nodes table for the trees. This can be created with a second Hierarchy statement, but now one that links to the tree ID instead of the node ID. (The “Trees” table in the picture below.)
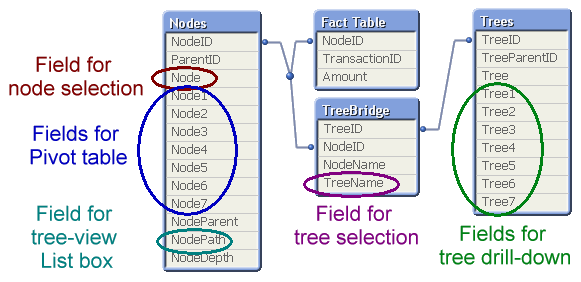
 

Data model full - BP.png


The data model with the three hierarchy tables is the one I recommend: It generates all fields you need.


A more elaborate explanation with script examples can be found in the technical brief about Hierarchies.


HIC


Further reading related to this topic:

Authorization using a Hierarchy

Bill of Materials

44 Comments
Not applicable

Hi Henrik,

I have an issue with Hierachies. I have written your article but I dont understand.

Could you please have a look at my Question:

Hierarchie Listbox

Thanks.

Chris

0 Likes
986 Views
Not applicable

Hi Henric,

How did you change the view form horizontal columns into vertical columns without the node names? Meaning I will need to convert the left pivot table into the right table as in the image below.  I tried Indent Mode but that still is in a horizontal layout.  Thanks.

2016-02-17 10_30_54-Hierarchies.pdf ‎- Microsoft Edge.png

0 Likes
986 Views
hic
Former Employee
Former Employee

"Indent mode" is the answer. But you also need to check "Use Only First Dimension Label" which is right below.

HIC

0 Likes
986 Views
Not applicable

Hi Henric,

I've figured this out.  It's to do with the setting of sub totals at top.

https://help.qlik.com/en-US/qlikview/12.0/Subsystems/Client/Content/Chart_Properties_Presentation_Pi...

0 Likes
986 Views
Anonymous
Not applicable

Henric, thank you for posting on this topic. I've got a ragged, unbalanced hiearchy that contains other data points (Manager ID, Long Name) and I'd like to maintain for each level. I could see a point where we could use the ManagerID to manage access to an app in the future apps. How do you maintain that additional information at each level? Thank you in advance!

0 Likes
986 Views
anagharao
Creator II
Creator II

Hi Henric,

I have a nlevel unblanced structure without the parentID.

The columns are something like this:

     1. NodeID

     2. NodeName

     3. Level

     4. Level1ID

     5. Level1Name

     6. Level2ID

     7. Level2Name... (with 16 levels)

The level(column 3) provides the level of the leaf in that row.

The rows have data like:

1,ANZ_Total,1,1,ANZ_Total

2,Australia,2,1,ANZ_Total,2,Australia

...

The fact table links to some of the NodeID and not all records in this table.

Could you please help me in creating a Tree structure for this to display in a listbox.

Also, i could not resolve the problem where in the town levels show the summed up values of that below them. The list box i created could only show facts when the lowest level(that is linked to fact) is selected.

Please help.

0 Likes
986 Views
Anonymous
Not applicable

Very Helpful

0 Likes
1,052 Views
Anonymous
Not applicable

‌ Hi Henric,

thank you hic for the post. I was wondering if you or somebody have some hints for me.

I have unbalanced suppliers hierarchy with max. NodeDepth = 9. So it is not like one three but hundreds threes with depth between 1 and 9. I put all the nodes (means node1 to node9) into the pivot table.

Challenges:

1. The hierarchy displays '-' for the parent node as you can see below Europe and than '-' with 11 probably for Europe and second '-' with 85 probably for France. Is there any simple solution to display "Europe" instead of '-' except If-statement in the script to exchange NodeName+1 with NodeName if the NodeName+1 is empty? 

2. If I have a three with e.g. only 4 nodes, how to disable the display of the node 5 to 9 in the pivot table since I have as dimension in the table node 1 to 9, but for the selected supplier has max Depth of 4. Please see below....

I am defining the Enable Condition for each Dimension e.g. for Node7 'if(Max(NODEDEPTH)>6,1,0)', is there probably some elegant solutions for this challenge.

Thank you very much in advance

Regards,

Mikhail

0 Likes
1,052 Views
Not applicable

Hi Mikhail,

Maybe you can try to check Suppress When Value is Null in Pivot Chart Dimension.

check suppress.png

Regards,

Qwerty

0 Likes
1,052 Views
er_abhichandra
Contributor III
Contributor III

Hi hic,

I am trying to create a complete hierarchy data model as specified in this blog. However, the magnitude of the number of values are quite large and the hierarchy could possible go over 20 levels and it's  taking a very long time. My requirement is to create a hierarchy only up to 5 levels down from the top. Is there any way that I can do this without having to process entire data set?

0 Likes
1,052 Views