Unlock a world of possibilities! Login now and discover the exclusive benefits awaiting you.
Recent Documents
-
Qlik Sense Enterprise on Windows patch version not visible in Programs and Featu...
After upgrading to Microsoft Windows Server 2025, the installed Qlik Sense Enterprise on Windows patch version is no longer visible in the Installed U... Show MoreAfter upgrading to Microsoft Windows Server 2025, the installed Qlik Sense Enterprise on Windows patch version is no longer visible in the Installed Updates summary.
In previous Windows Server versions, navigating to Control Panel > Programs and Features > Installed Updates displayed the patch version.
Changes in Windows Server 2025 affect how installed updates are displayed in the Control Panel. This does not indicate a failed installation.
You can verify what patch version of Qlik Sense Enterprise on Windows you have installed by retrieving it from the Windows registry. Alternatively, see What version of Qlik Sense Enterprise on Windows am I running?
Resolution
The registry key including the patch version is:
Computer\HKEY_LOCAL_MACHINE\SOFTWARE\Wow6432Node\Microsoft\Windows\CurrentVersion\Uninstall\QlikSenseEnterprisePatch
You can query the registry using PowerShell.
Administrator privileges are required to access the Registry or to run the recommended PowerShell script.
Option One: Use Get-QlikSensePatchInfo.ps1
We recommend using the attached Get-QlikSensePatchInfo.ps1 script.
- Download Get-QlikSensePatchInfo.zip and extract it
- Run Get-QlikSensePatchInfo.ps1
- The script will return:
- DisplayName: Patch name
- DisplayVersion: Patch version number
- UninstallString: Uninstall command
Example output:
DisplayName : Qlik Sense May 2025 Patch 17
DisplayVersion : 14.231.29
UninstallString : "C:\ProgramData\Package Cache\c70a85bf-ecb8-4772-affb-80f28a97bdcb\Qlik_Sense_update.exe"Option Two: Query the registry manually
- Open a PowerShell command line with elevated permissions
- Run the following PowerShell command:
Get-ItemProperty "HKLM:\SOFTWARE\Wow6432Node\Microsoft\Windows\CurrentVersion\Uninstall\QlikSenseEnterprisePatch" | Select-Object DisplayName, DisplayVersion, UninstallString
Environment
- Qlik Sense Enterprise on Windows
- Windows Server 2025
-
Qlik Sense Data Connectors are missing
Qlik Sense Connectors are missing from the Data source except few REST connectors. Resolution Solution 1 Repair Qlik Sense with the Qlik Sense Setup ... Show MoreQlik Sense Connectors are missing from the Data source except few REST connectors.
Resolution
Solution 1
Repair Qlik Sense with the Qlik Sense Setup file (identical version).
Solution 2
- Obtain a copy of the folder "C:\Program Files\Common Files\Qlik\Custom Data\" from a different, but working Qlik Sense Enterprise on a Windows environment (identical version). A test installation can be set up to obtain it.
- Replace the files/folders with the copied version. This action needs to be carried out on all nodes if it is a multi-node environment.
Solution 3
Encryption keys:
- Verify if the Encryption keys are present in the User's directory.
- Check if you have multiple encryption keys stored in the User's directory.
- Delete and recreate the Encryption keys using Setting an encryption key
Encryption keys will be stored in either "C:\Users\{sense service user}\AppData\Roaming\Qlik\QwcKeys\" Or "C:\Users\{sense service user}\AppData\Roaming\Qlik\Keys\"
Cause
- The Connector folders or executables are corrupted or deleted.
- Connector folders or executables are being scanned and removed from their path. Therefore, it is mandatory to exclude Qlik folders if any scanning software is present on Qlik Sense Windows machines. For more information about exclusions, please refer to the document titled Qlik Sense Folder And Files To Exclude From Anti-Virus Scanning
- Encryption Keys are either deleted or corrupted.
Related Content
An error occurred / Failed to load connection error message in Qlik Sense - Server Has No Internet
Environment
-
An error occurred / Failed to load connection error message in Qlik Sense - Serv...
***Changes must be made to all Qlik servers that will not be provided with internet access.***For servers not connected to the internet, they may be ... Show More
***Changes must be made to all Qlik servers that will not be provided with internet access.***
For servers not connected to the internet, they may be prompted with a pop-up error when browsing in the Hub or in the Data Load Editor with the following errors:- The Hub has continuous bubbles while loading forever
- The Hub is stuck on the initial loading bar
Browser Debug tools may display the following error in the console:
Data Market: entry-point-building.js??123145:62
API could not be reached.
Cause:
This was originally defined as an issue with the Qlik Sense DataMarket connector executable, which is cryptography signed for authenticity verification, and the .NET Framework's verification procedure when launching an executable includes checking OCSP and Certificate Revocation List information, which means fetching it online if the system doesn't have a fresh cached copy locally.
Even without the QlikData Market being in use, the solutions provided can be deployed when encountering issues with Qlik Sense Enterprise Windows servers that have no internet access. Internet access is recommended.
Resolution
Only deploy one of the below options.
Option 1 will persist through upgrades, whereas Option 2 would have to be reapplied after every Sense upgrade.
Option 1:
- Stop all Qlik Sense services on all nodes
- Edit C:\Windows\Microsoft.NET\Framework64\v4.0.30319\config\machine.config
- If there is an empty <runtime/> tag, change it to
<runtime> <generatePublisherEvidence enabled="false"/> </runtime> - If there is no <runtime/> tag, add the below anywhere above the closing </configuration> tag.
<runtime>
    <generatePublisherEvidence enabled="false"/>
</runtime>
- If the <runtime> section has existing content, add generatePublisherEvidence.
<runtime>
  <some other key="value"/>
  <generatePublisherEvidence enabled="false"/>
</runtime>
Example:
- If there is an empty <runtime/> tag, change it to
- Save machine.config
- Repeat on all nodes (if applicable)
- Start services on all nodes
Option 2:
- Stop all services on all nodes
- Open C:\Program Files\Common Files\Qlik\Custom Data\QvRestConnector\QvRestConnector.exe.config in an admin level Notepad window
- If there is an empty <runtime/> tag, change it to
<runtime> <generatePublisherEvidence enabled="false"/> </runtime> - If there is no <runtime/> tag, add the below anywhere above the closing </configuration> tag.
<runtime> <generatePublisherEvidence enabled="false"/> </runtime> - If the <runtime> section has existing content, add generatePublisherEvidence.
<runtime>
  <some other key="value"/>
  <generatePublisherEvidence enabled="false"/>
</runtime>
- If there is an empty <runtime/> tag, change it to
- 4. Repeat on all nodes and repeat for all .config files
- C:\Program Files\Common Files\Qlik\Custom Data\QvOdbcConnectorPackage\QvOdbcConnectorPackage.exe.config
- C:\Program Files\Common Files\Qlik\Custom Data\QvDataMarketConnector\QvDataMarketConnector.exe.config
- C:\Program Files\Common Files\Qlik\Custom Data\QvSalesforceConnector\QvSalesforceConnector.exe.config
- C:\Program Files\Common Files\Qlik\Custom Data\QvEssbaseConnector
- C:\Program Files\Common Files\Qlik\Custom Data\QvRestConnector
- C:\Program Files\Common Files\Qlik\Custom Data\QvWebStorageProviderConnectorPackage
- Start all services on all nodes
- Validate
It may be necessary to include the key immediately before the runtime closing tag if there are many values in the runtime section.
For Qlik Versions 2.x.x [mid-2016 and older]... this will fully disable Qlik Sense DataMarket:
Remove OR rename the file on all nodes
C:\Program Files\Common Files\Qlik\Custom Data\QvDataMarketConnector
NOTE: This folder is likely to be re-created upon upgrade.
-
Qlik Cloud: Content restricted or unavailable with Embedded Analytics User role ...
The Embedded Analytics User role is a role available in Qlik Cloud for use cases where your users should not access the Qlik Cloud hub directly. If t... Show More -
How to disable the App Distribution Service (ADS) on a machine in a multinode en...
In a Windows multi-node deployment, the App Distribution Service (ADS) distributes apps from Qlik Sense Enterprise on Windows to Qlik Sense Enterprise... Show MoreIn a Windows multi-node deployment, the App Distribution Service (ADS) distributes apps from Qlik Sense Enterprise on Windows to Qlik Sense Enterprise SaaS. The service is installed on every node. However, Qlik Sense does not have load balancing for ADS, meaning if not all nodes have access to the apps, distribution may fail. See App Distribution from Qlik Sense Enterprise to Qlik Cloud fails when distributed from RIM NODE.
If you wish to disable app distribution from certain nodes:
- Log on to Qlik Sense node on which you wish to disable App Distribution.
- Stop the Qlik Sense Dispatcher Service.
- Open the "C:\Program Files\Qlik\Sense\ServiceDispatcher\services.conf" file with Notepad or any text editors.
- Find the [appdistributionservice] section and the[hybriddeploymentservice] section.
- Disable both by setting it to Disabled=true.
[appdistributionservice] Disabled=true Identity=Qlik.app-distribution-service DisplayName=App Distribution Service ExePath=dotnet\dotnet.exe UseScript=false [hybriddeploymentservice] Disabled=true Identity=Qlik.hybrid-deployment-service DisplayName=Hybrid Deployment Service ExePath=dotnet\dotnet.exe UseScript=false - Save the file.
- Restart the Qlik Sense Dispatcher Service.
Environment
- Qlik Sense multi-cloud environments. Any versions.
-
Qlik Talend Administration Center: You are using # DI users, but your license al...
After updating the license, connecting to the Talend Administration Center fails with: You are using # DI users, but your license allows only #, pleas... Show MoreAfter updating the license, connecting to the Talend Administration Center fails with:
You are using # DI users, but your license allows only #, please contact your account manager.
Resolution
Two solutions exist.
Deactivate Unused Users via Security Account
- Log in to Qlik Talend Administration Center using a Security Administrator or the default security account.
For information about the default security account, see Change the default password used to configure the database for details. - After logging in, navigate to Settings > Users and deactivate any unused or excess users
Modify Users Directly in Qlik Talend Administration Center Database
- Access the Qlik Talend Administration Center database directly
- Locate the user table and review existing users:
- Identify unused users
- Verify user types against the new license
- Update user types to comply with license constraints (e.g., change DQ to DI) or delete unnecessary users
License downgrade behavior: When downgrading licenses (for example, from DQ seats to DI seats), user configurations must also be updated.
- Users previously assigned as DQ must be manually changed to DI
- Failure to update the user type may cause access issues or license mismatches
Cause
The issue occurs due to a mismatch between the number or type of users defined in the system and those allowed by the updated license.
- The Available Users section reflects:
- The number of users currently created under active licenses
- The total number of users permitted by those licenses
- After a license update:
- If the user type and/or user count exceeds the new license limits, the system triggers the error
- Qlik Talend Administration Center functionality is restricted until the discrepancy is resolved
About User Types and License Seats
In Qlik Talend Administration Center, users are assigned different license seat types depending on their access rights and functional domain.
The main user/license types are:
- DI (Data Integration / ESB user)
Used for Data Integration and ESB-related activities. - DQ (Data Quality / Data Management user)
Used for Data Quality and data stewardship tasks. - MDM (Master Data Management user)
Used for Master Data Management domain. - NPA (No Project Access)
Users with no project-level access.
For more information regarding license types and features for users, see What domains can you work in depending on your user type and license.
Environment
- Qlik Talend Administration Center
- Log in to Qlik Talend Administration Center using a Security Administrator or the default security account.
-
Qlik Talend Cloud: collecting logs and useful information for troubleshooting
When reaching out to Qlik Support for Qlik Talend Cloud pipeline and data integration issues, you may be asked to provide additional information and l... Show MoreWhen reaching out to Qlik Support for Qlik Talend Cloud pipeline and data integration issues, you may be asked to provide additional information and logging.
This list is meant to serve as an index for the guides on obtaining requested logs:
- Tenant ID and URL: Find your Qlik Cloud Subscription ID and Tenant Hostname and ID
- Data movement gateway repagent and repsrv logs: Troubleshooting Data Movement gateway
- Export the data pipeline and replication project:
- Export task diagnostics package (only available for Landing and Replication tasks): Qlik Cloud: How to collect Diagnostics Package for Integration Projects
- Task events log: How to download task event JSON files from Qlik Talend Cloud
Environment
- Qlik Talend Cloud
-
Qlik Talend Cloud: download network integration logs
This article documents how to download the Network Integrations logs to troubleshoot issues occurring with Open Lakehouse in Qlik Talend Cloud. For in... Show MoreThis article documents how to download the Network Integrations logs to troubleshoot issues occurring with Open Lakehouse in Qlik Talend Cloud.
For information on what permissions are required to view and configure Network Integrations, see Permissions | Network integrations.
To download the logs:
- Open the Administration Center
- Navigate to Lakehouse Clusters
- Click the ellipses menu (...) to the right of the desired integration
- Click View Logs
Environment
- Qlik Talend Cloud
-
Qlik Talend Cloud: viewing project and task information
To view general project information, click on the (i) icon left of the Show tasks button: There you will find: Project name as the header Created ... Show MoreTo view general project information, click on the (i) icon left of the Show tasks button:
There you will find:
- Project name as the header
- Created date of the project
- Owner or creator of the project
- Space
- Use case or type of project (data vs replication)
- Data platform
- Connection or target connection used by the project
- Project Id or unique ID that can be requested by Qlik Support during troubleshooting
To view general task information, click on the (i) icon in the top left corner of the task page:
There you will find all of the same information as for the project information (including Created), except the Data task runtime Id which is another unique ID that Support can request for troubleshooting.
Environment
- Qlik Talend Cloud
-
Restore deleted app in Qlik Sense, Import app in Qlik Sense
A Qlik Sense app has been deleted from the Qlik Sense Management Console and needs to be restored. ! Deleting Qlik Sense application from Qlik Managem... Show MoreA Qlik Sense app has been deleted from the Qlik Sense Management Console and needs to be restored.
! Deleting Qlik Sense application from Qlik Management Console (QMC) is generally an irreversible process. Restoring the applications is only possible if a previous backup exists. The delete process removes all files from the configured file share. See Creating a file share (Help.com).
If a backup of the files exists, proceed with the documented steps.
Note that these steps can also be applied when restoring and importing from one Qlik Sense environment to the other.
Information on server migration has also be posted to Qlik Community: Qlik Sense Migration Part1: Migrating your Entire Qlik Sense Environment. If assistance is needed, Qlik Consulting would need to be engaged. Qlik Support cannot provide walk-through assistance with server migrations outside of a post-installation and migration completion break/fix scenario.
Resolution:
To successfully restore Qlik Sense Application to the Qlik Sense environment, you must ensure backup strategy using your backup software tool for your shared folder, where Qlik Sense Application files are stored.
! If no backups of files are available, no restoration will be possible.
Restore process:
1. Find the App filename
You can find the filename (APP_ID) in the AuditActivity_Engine log.
This log is by default stored in: \\<rootShare>\Log\Engine\Audit\ by default.
An example showing App id followed by App name follows:
492 20.4.2.0 20180521T180500.118+0200 QlikServer1 0ccd5e9f-e020-4b76-a84d-144bdf903765 20180521T180500.112+0200 12.145.3.0 Command=Reload app;Result=0;ResultText=Success 0 0 2290 INTERNAL sa_scheduler d296b870-da06-4311-bacc-038992b1c954 c047d8a7-148c-4ea6-97f2-10290e706cd7 License Monitor Engine Not available Doc::DoReloadEx Reload app 0 Success 0ccd5e9f-e020-4b76-a84d-144bdf903765
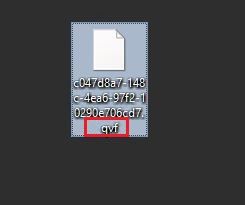
2. Add extension ".qvf" to the app file
This will make the file readable and importable.
- Navigate to the file on disk.
- Right-click and click rename
- Add .qvf as a file extension
- Confirm any warnings that the file may not be accessible any more after renaming
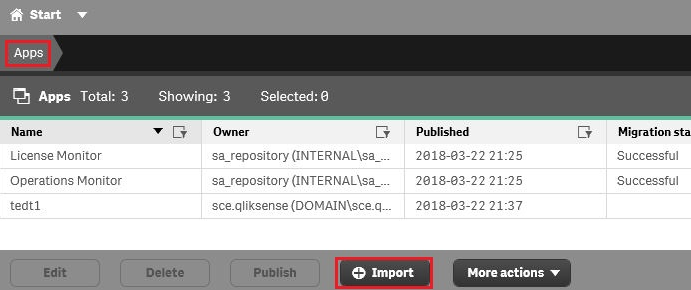
3. Import the App
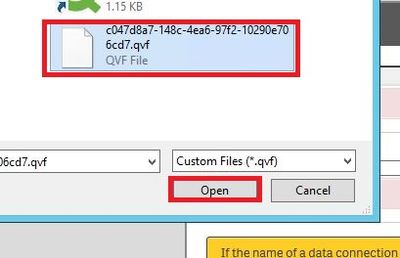
- Open the Qlik Sense Management Console
- Go to Apps
- Locate and click Import
- Locate the file on disk
- Click Open
- Rename the App to the original name
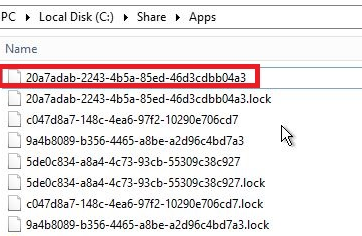
4. App has been imported and received a new APP_ID
You can now locate the app in the shared folder with a new App ID.
5. Find the proper stream where the app resides
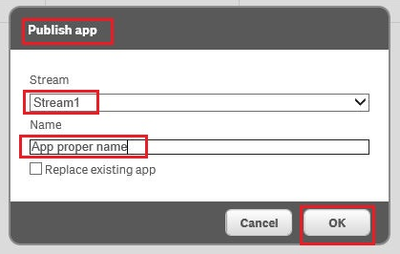
6. Go to section "APPS" select the app, hit "Publish"
Click Publish
The Publishing dialogue:
7. Hit "Ok", the app is being published - IMPORTED back
8. The confirmation message should now print as Successful in the App list.
-
Advanced Qlik Sense System Monitoring
Content ChaptersEnvironment overviewZabbix Server set-upClone the Zabbix docker repositorySetting up environment variablesRe-link compose.yaml to our ... Show MoreContent
- Chapters
- Environment overview
- Zabbix Server set-up
- Clone the Zabbix docker repository
- Setting up environment variables
- Re-link compose.yaml to our preferred compose file
- Logging in for the first time
- Zabbix Agent installation on Windows Server
- Zabbix Server Configuration
- Adding the first Server
- Importing Qlik Sense Enterprise for Windows templates
- Linking templates to hosts
- Engine Healthcheck Monitoring with HTTP Agent example
- Steps to configure a new HTTP Agent for QSE Health monitoring
- Defining the Virtual Proxy prefix for Zabbix HTTP Agent
- Resources & Links
Chapters
- 01:33 - Why use Zabbix
- 02:35 - Architecture for demo
- 03:41 - Downloading the installer
- 04:36 - Installing Zabbix Server
- 08:37 - Installing the Zabbix agent
- 12:17 - Applying Qlik specific templates
- 14:28 - Reviewing Qlik-specific Dashboards
- 16:49 - Configuration details
- 18:42 - How to create a dashboard
- 20:30 - Q&A: Can Zabbix run on Windows?
- 21:16 - Q&A: Is Zabbix supported by Qlik?
- 21:36 - Q&A: Can this monitor data capacity?
- 22:45 - Q&A: Can the Zabbix agents affect performance?
- 23:20 - Q&A: Can it monitor bookmark size?
- 24:02 - Q&A: Can this monitor amount of data being used?
- 24:19 - Q&A: Can this monitor sheets, and objects in apps?
- 24:49 - Q&A: Is there a similar tool for Cloud?
- 25:36 - Q&A: Would this work with QlikView?
- 26:11 - Q&A: Does this read the app data?
- 26:26 - Q&A: Can this help measure how long to open an app?
The information in this article and video is provided as is. If you need assistance with Zabbix, please engage with Zabbix directly.
Environment overview
The environment being demonstrated in this article consists of one Central Node and Two Worker Nodes. Worker 1 is a Consumption node where both Development and Production apps are allowed. Worker 2 is a dedicated Scheduler Worker node where all reloads will be directed. Central Node is acting as a Scheduler Manager.
Zabbix Server set-up
The Zabbix Monitoring appliance can be downloaded and configured in a number of ways, including direct install on a Linux server, OVF templates and self-hosting via Docker or Kubernetes. In this example we will be using Docker. We assume you have a working docker engine running on a server or your local machine. Docker Desktop is a great way to experiment with these images and evaluate whether Zabbix fits in your organisation.
Clone the Zabbix docker repository
This will include all necessary files to get started, including docker compose stack definitions supporting different base images, features and databases, such as MySQL or PostgreSQL. In our example, we will invoke one of the existing Docker compose files which will use PostgreSQL as our database engine.
Source: https://www.zabbix.com/documentation/current/en/manual/installation/containers#docker-compose
git clone https://github.com/zabbix/zabbix-docker.gitSetting up environment variables
Here you can modify environment variables as needed, to change things like the Stack / Composition name, default ports and many other settings supported by Zabbix.
cd ./zabbix-docker/env_vars
ls -la #to list all hidden files (.dotfiles)
nano .env_web
In this file, we will change the value for
ZBX_SERVER_NAMEto something else, like "Qlik STT - Monitoring". Save the changes and we are ready to start up Zabbix Server.Re-link compose.yaml to our preferred compose file
./zabbix-docker folder contains many different docker compose templates, either using public images or locally built (latest and local tags).
You can run your chosen base image and database version with:
docker compose -f compose-file.yaml up -d && docker compose logs -f --since 1mOr unlink and re-create the symbolic link to compose.yaml, which enables managing the stack without specifying a compose file. Run the following commands inside the
zabbix-dockerfolder to use the latest Ubuntu-based image with PostgreSQL database:unlink compose.yamlln -s ./docker-compose_v3_ubuntu_pgsql_latest.yaml compose.yaml- Start the Zabbix stack in detached mode with
docker compose up -d
If you skip the
-dflag, the Docker stack will start and your command line will be connected to the log output for all containers. The stack will stop if you exit this mode with CTRL+C or by closing the terminal session. Detached mode will run the stack in background. You can still connect to the live log output, pull logs from history, manage the stack state or tear it down usingdocker compose down.Pro tip: you will be using
docker composecommands often when working with Docker. You can create an alias in most shells to a short-hand, such as "dc = docker compose". This will still accept all following verbs, such asstart|stop|restart|up|down|logsand all following flags.docker compose up -d && docker compose logs -f --since 1mwould becomedc up -d && dc logs -f --since 1m.Logging in for the first time
- By default, the Zabbix Web GUI will be exposed on ports 80/443
- Using tools like Portainer makes Docker stack management easier
Use the IP address of your Docker host: http://IPADDRESS or https://IPADDRESS.
The Zabbix server stack can be hosted behind a Reverse Proxy.
The default username is
Adminand the default password iszabbix. They are case sensitive.Zabbix Agent installation on Windows Server
Download link: https://www.zabbix.com/download_agents, in this case download the Windows installer MSI.
- Run the installer .msi
- Leave components unchanged
- Hostname = your machine hostname, we will have to use the same hostname when adding a Host in Zabbix Server.
- Zabbix server IP/DNS: IP address or DNS name of your Zabbix Server
- Agent listening port, the same port will be used when when adding a Host in Zabbix Server.
- Enable "Add agent location to the PATH" for convenience in the command line
- Finish installation
Zabbix Server Configuration
Adding the first Server
After Agent is installed, in Zabbix go to Data Collection > Hosts and click on Create host in the top right-hand corner. Provide details like hostname and port to connect to the Agent, a display name and adjust any other parameters. You can join clusters with Host groups. This makes navigating Zabbix easier.
Fig 1: Adding a Host
Note: Remember to change how Zabbix Server will connect to the Agent on this node, either with IP address or DNS. Note that the default IP address points to the Zabbix Server.
Importing Qlik Sense Enterprise for Windows templates
In the Zabbix Web GUI, navigate to Data Collection > Templates and click on the Import button in the top right-hand corner. You can find the templates file at the following download link:
LINK to zabbix templates
Linking templates to hosts
Once you have added all your hosts to the Data Collection section, we can link all Qlik Sense servers in a cluster using the same templates. Zabbix will automatically populate metrics where these performance counters are found. From Data Collection > Hosts, select all your Qlik Sense servers and click on "Mass update". In the dialog that comes up, select the "Link templates" checkbox. Here you can link/replace/unlink templates across many servers in bulk.
Select "Link" and click on the "Select" button. This new panel will let us search for Template groups and make linking a bit easier. The Template Group we provided contains 4 individual templates.
Fig 2: Mass update panel
Fig 3: Search for Template Group
Once you Select and Update on the main panel, all selected Hosts will receive all items contained in the templates, and populate all graphs and Dashboards automatically.
To review your data, navigate to Monitoring > Hosts and click on the "Dashboards" or "Graphs" link for any node, here is the default view when all Qlik Sense templates are linked to a node:
Fig 4: Host Dashboards
Fig 5: Repository Service metrics - Example
Engine Healthcheck Monitoring with HTTP Agent example
We will query the Engine Healthcheck end-point on QlikServer3 (our consumer node) and extract usage metrics from by parsing the JSON output.
Steps to configure a new HTTP Agent for QSE Health monitoring
We will be using a new Anonymous Access Virtual Proxy set up on each node. This Virtual Proxy will only Balance on the node it represents, to ensure we extract meaningful metrics from the Engine and we won't be load-balanced by the Proxy service across multiple nodes. There won't be a way to determine which node is responding, without looking at DevTools in your browser. You can also use Header or Certificate authentication in the HTTP Agent configuration.
Once the Virtual Proxy is configured with Anonymous Only access, we can use this new prefix to configure our HTTP Agent in Zabbix.
Defining the Virtual Proxy prefix for Zabbix HTTP Agent
In the Zabbix web GUI, go to Data collection > Hosts. Click on any of your hosts. On tabs at the top of the pop-up, click on Macros and click on the "Inherited and host macros" button. Once the list has loaded, search for the following Macro: {$VP_PREFIX}. This is set by default to "anon". Click on "Change" and set Macro value to your custom Virtual Proxy Prefix for Engine diagnostics, and click Update. The Virtual Proxy prefix will have to be changed on each node for the "Engine Performance via HTTP Agent" item to work. Alterantively, you can modify the MACRO value for the Template, this will replicate the changes across all nodes associated to this Template.
Fig 6: Changing Host Macros from Inherited values
To make this change at the Template level, go to Data collection > Templates. Search for the "Engine Performance via HTTP Agent" and click on the Template. Navigate to the Macros tab in the pop-up and add your Virtual Proxy Prefix here to make this the new default for your environment. No further changes to Node configuration are required at this point.
Fig 7: Changing Macros at the Template level
The Zabbix templates provided in this article contain the following Engine metric JSONParsers:
- Memory: Allocated, Committed, Free, Total Physical
- Calls, Selections
- Saturation status (true/false)
- Sessions: Active/Total
- Users: Active/Total
These are the same performance counters that you can see in the Engine Health section in QMC.
Stay tuned to new releases of the Monitoring Templates. Feel free to customise these to your needs and share with the Community.
Resources & Links
- Zabbix home page
- Zabbix Installation from containers documentation
- Zabbix Docker repository on GitHub
- Install Docker Engine on Ubuntu
Environment
- Qlik Sense Enterprise on Windows
-
The Qlik Sense Monitoring Applications for Cloud and On Premise
Qlik Sense Enterprise Client-Managed offers a range of Monitoring Applications that come pre-installed with the product. Qlik Cloud offers the Data Ca... Show MoreQlik Sense Enterprise Client-Managed offers a range of Monitoring Applications that come pre-installed with the product.
Qlik Cloud offers the Data Capacity Reporting App for customers on a capacity subscription, and additionally customers can opt to leverage the Qlik Cloud Monitoring apps.
This article provides information on available apps for each platform.
Content:
- Qlik Cloud
- Data Capacity Reporting App
- Access Evaluator for Qlik Cloud
- Answers Analyzer for Qlik Cloud
- App Analyzer for Qlik Cloud
- Automation Analyzer for Qlik Cloud
- Entitlement Analyzer for Qlik Cloud
- Reload Analyzer for Qlik Cloud
- Report Analyzer for Qlik Cloud
- How to automate the Qlik Cloud Monitoring Apps
- Other Qlik Cloud Monitoring Apps
- OEM Dashboard for Qlik Cloud
- Monitoring Apps for Qlik Sense Enterprise on Windows
- Operations Monitor, License Monitor, and Content Monitor
- App Metadata Analyzer
- The Monitoring & Administration Topic Group
- Other Apps
Qlik Cloud
Data Capacity Reporting App
The Data Capacity Reporting App is a Qlik Sense application built for Qlik Cloud, which helps you to monitor the capacity consumption for your license at both a consolidated and a detailed level. It is available for deployment via the administration activity center in a tenant with a capacity subscription.
The Data Capacity Reporting App is a fully supported app distributed within the product. For more information, see Qlik Help.
You can automate daily distribution of the latest app using the Capacity consumption app deployer template in Qlik Automate.
Access Evaluator for Qlik Cloud
The Access Evaluator is a Qlik Sense application built for Qlik Cloud, which helps you to analyze user roles, access, and permissions across a tenant.
The app provides:
- User and group access to spaces
- User, group, and share access to apps
- User roles and associated role permissions
- Group assignments to roles
For more information, see Qlik Cloud Access Evaluator.
Answers Analyzer for Qlik Cloud
The Answers Analyzer provides a comprehensive Qlik Sense dashboard to analyze Qlik Answers metadata across a Qlik Cloud tenant.
It provides the ability to:
- Track user questions across knowledgebases, assistants, and source documents
- Analyze user behavior to see what types of questions users are asking about what content
- Optimize knowledgebase sizes and increase answer accuracy by removing inaccurate, unused, and unreferenced documents
- Track and monitor page size to quota
- Ensure that data is kept up to date by monitoring knowledgebase index times
- Tie alerts into metrics, (e.g. a knowledgebase hasn't been updated in over X days)
For more information, see Qlik Cloud Answers Analyzer.
App Analyzer for Qlik Cloud
The App Analyzer is a Qlik Sense application built for Qlik Cloud, which helps you to analyze and monitor Qlik Sense applications in your tenant.
The app provides:
- User sessions by app, sheets viewed
- Large App consumption monitoring
- App, Table and Field memory footprints
- Synthetic keys and island tables to help improve app development
- Threshold analysis for fields, tables, rows and more
- Reload times and peak RAM utilization by app
For more information, see Qlik Cloud App Analyzer.
Automation Analyzer for Qlik Cloud
The Automation Analyzer is a Qlik Sense application built for Qlik Cloud, which helps you to analyze and monitor Qlik Application Automation runs in your tenant.
Some of the benefits of this application are as follows:
- Track number of automations by type and by user
- Analyze concurrent automations
- Compare current month vs prior month runs
- Analyze failed runs - view all schedules and their statuses
- Tie in Qlik Alerting
For more information, see Qlik Cloud Automation Analyzer.
Entitlement Analyzer for Qlik Cloud
The Entitlement Analyzer is a Qlik Sense application built for Qlik Cloud, which provides Entitlement usage overview for your Qlik Cloud tenant for user-based subscriptions.
The app provides:
- Which users are accessing which apps
- Consumption of Professional, Analyzer and Analyzer Capacity entitlements
- Whether you have the correct entitlements assigned to each of your users
- Where your Analyzer Capacity entitlements are being consumed, and forecasted usage
For more information, see The Entitlement Analyzer.
Reload Analyzer for Qlik Cloud
The Reload Analyzer is a Qlik Sense application built for Qlik Cloud, which provides an overview of data refreshes for your Qlik Cloud tenant.
The app provides:
- The number of reloads by type (Scheduled, Hub, In App, API) and by user
- Data connections and used files of each app’s most recent reload
- Reload concurrency and peak reload RAM
- Reload tasks and their respective statuses
For more information, see Qlik Cloud Reload Analyzer.
Report Analyzer for Qlik Cloud
The Report Analyzer provides a comprehensive dashboard to analyze metered report metadata across a Qlik Cloud tenant.
The app provides:
- Current Month Reports Metric
- History of Reports Metric
- Breakdown of Reports Metric by App, Event, Executor (and time periods)
- Failed Reports
- Report Execution Duration
For more information, see Qlik Cloud Report Analyzer.
How to automate the Qlik Cloud Monitoring Apps
Do you want to automate the installation, upgrade, and management of your Qlik Cloud Monitoring apps? With the Qlik Cloud Monitoring Apps Workflow, made possible through Qlik's Application Automation, you can:
- Install/update the apps with a fully guided, click-through installer using an out-of-the-box Qlik Application Automation template.
- Programmatically rotate the API key that is required for the data connection on a schedule using an out-of-the-box Qlik Application Automation template. This ensures that the data connection is always operational.
- Get alerted whenever a new version of a monitoring app is available using Qlik Data Alerts.
For more information and usage instructions, see Qlik Cloud Monitoring Apps Workflow Guide.
Other Qlik Cloud Monitoring Apps
OEM Dashboard for Qlik Cloud
The OEM Dashboard is a Qlik Sense application for Qlik Cloud designed for OEM partners to centrally monitor usage data across their customers’ tenants. It provides a single pane to review numerous dimensions and measures, compare trends, and quickly spot issues across many different areas.
Although this dashboard is designed for OEMs, it can also be used by partners and customers who manage more than one tenant in Qlik Cloud.
For more information and to download the app and usage instructions, see Qlik Cloud OEM Dashboard & Console Settings Collector.
With the exception of the Data Capacity Reporting App, all Qlik Cloud monitoring applications are provided as-is and are not supported by Qlik. Over time, the APIs and metrics used by the apps may change, so it is advised to monitor each repository for updates and to update the apps promptly when new versions are available.
If you have issues while using these apps, support is provided on a best-efforts basis by contributors to the repositories on GitHub.
Monitoring Apps for Qlik Sense Enterprise on Windows
Operations Monitor, License Monitor, and Content Monitor
The Operations Monitor loads service logs to populate charts covering the performance history of hardware utilization, active users, app sessions, results of reload tasks, and errors and warnings. It also tracks changes made in the QMC that affect the Operations Monitor.
- Basic information can be found in Operations Monitor | help.qlik.com
- Detailed descriptions of sheets and visualizations are accessible in the About the Operations Monitor story available from the app overview page under Stories
The License Monitor loads service logs to populate charts and tables covering token allocation, usage of login and user passes, and errors and warnings.
- Basic information can be found in License Monitor | help.qlik.com
- Detailed descriptions of sheets and visualizations are accessible in the About the License Monitor story available from the app overview page under Stories
The Content Monitor loads from the APIs and logs to present key metrics on the content, configuration, and usage of the platform, allowing administrators to understand the evolution and origin of specific behaviors of the platform.
- Basic information can be found in Content Monitor | help.qlik.com
- Each sheet in the Content Monitor includes an About text box to describe its content.
All three apps come pre-installed with Qlik Sense.
If a direct download is required: Sense License Monitor | Sense Operations Monitor | Content Monitor (download page). Note that Support can only be provided for Apps pre-installed with your latest version of Qlik Sense Enterprise on Windows.
App Metadata Analyzer
The App Metadata Analyzer app provides a dashboard to analyze Qlik Sense application metadata across your Qlik Sense Enterprise deployment. It gives you a holistic view of all your Qlik Sense apps, including granular level detail of an app's data model and its resource utilization.
Basic information can be found here:
App Metadata Analyzer (help.qlik.com)
For more details and best practices, see:
App Metadata Analyzer (Admin Playbook)
The app comes pre-installed with Qlik Sense.
The Monitoring & Administration Topic Group
Looking to discuss the Monitoring Applications? Here we share key versions of the Sense Monitor Apps and the latest QV Governance Dashboard as well as discuss best practices, post video tutorials, and ask questions.
Other Apps
LogAnalysis App: The Qlik Sense app for troubleshooting Qlik Sense Enterprise on Windows logs
Sessions Monitor, Reloads-Monitor, Log-Monitor
Connectors Log AnalyzerAll Other Apps are provided as-is and no ongoing support will be provided by Qlik Support.
-
Can I restore a previous backup of a Qlik Cloud tenant?
According to the Qlik Cloud Platform document, Qlik leverages our cloud providers for backups to maintain copies of content for 30 days. Can I restore... Show MoreAccording to the Qlik Cloud Platform document, Qlik leverages our cloud providers for backups to maintain copies of content for 30 days.
Can I restore one of those backups?
No, those backups cannot be restored. They are kept for disaster recovery purposes (see Disaster recovery/backup and recovery) and encompass entire regions.
It's therefore not possible to recover a tenant's previous stage.
It's the tenant admin's responsibility to make sure that copies of the content are regularly backed up on any platform of choice for easy restoration. See Qlik Cloud Administration: Backup Responsibilities for details.
Environment
- Qlik Cloud Analytics
-
Qlik Cloud Analytics: Sharing a single app shares the entire space the app is lo...
In some instances, when a user shares a single app using the Share > Invite or Share > Manage Access option, the entire space is shared as well. Re... Show MoreIn some instances, when a user shares a single app using the Share > Invite or Share > Manage Access option, the entire space is shared as well.
Resolution
There are two possible root causes. Both are triggered by the user not having the correct permissions to share an app, but having permissions to share the space. In this instance, the system defaults to sharing the whole space.
Qlik is working on an improvement to clarify what you are sharing, meaning you will be alerted you are sharing the space in the future.
The two scenarios:
- Sharing applications via fine-grained access control is disabled in the User default or for the user.
This affects all spaces.
To resolve this, either enable it globally or create a custom role that allows the use of fine-grained access control. See Managing custom roles. - The user is a tenant admin, allowing them to share spaces, but is not the owner of the space and does not have Can Manage permissions.
This affects specific spaces.
To resolve this, grant the user Can Manage permissions on the space or make them the owner.While this is currently by design, Qlik plans to change this behaviour in the upcoming feature to make this action unnecessary.
Environment
- Qlik Cloud Analytics
- Sharing applications via fine-grained access control is disabled in the User default or for the user.
-
Qlik Cloud Administration: Backup Responsibilities
Qlik Cloud includes robust disaster recovery and backup mechanisms for active tenant data. See Adaptive high-availability infrastructure for details. ... Show MoreQlik Cloud includes robust disaster recovery and backup mechanisms for active tenant data. See Adaptive high-availability infrastructure for details.
However, this does not mean data that has been deleted by the customer is being retained. Any intentionally or accidentally deleted Qlik Cloud data cannot be recovered by Qlik. See Qlik Cloud Analytics: Is it Possible to Recover a Deleted App or Sheet?
To prevent data loss, customers are responsible for implementing their own backup strategy for any content that may be removed. This includes apps, sheets, and spaces within the Qlik Cloud environment.
How to Back Up Qlik Cloud Apps
There are several ways to back up Qlik Cloud content:
Qlik Automate
Qlik Automate supports the creation of workflows that regularly back up apps within Qlik Cloud. These workflows can, for example, be configured to export apps to external storage, synchronize content between spaces, or integrate with version control systems.
Here are some helpful resources to get started:
- CI/CD pipelines for Qlik Sense apps with automations and GitHub
- How to export a Qlik Sense app without data to an Amazon S3 bucket and import an app from a file on Amazon S3
- How to export Qlik Sense Apps from source to a target shared space using Qlik Application Automation
These automations can be tailored to meet organizational backup requirements and integrated into broader content management strategies.
Qlik CLI
Qlik CLI enables app exports using command-line tools.
For more information regarding Qlik CLI, please see this introduction on the Qlik Developer Portal.
With Qlik CLI installed, the “qlik app export <appId> [flags]” command can be used to export an app. More information about the command and its available flags can be found on its Qlik Developer Portal page.
Qlik REST APIs
The public Qlik REST APIs can be used to build a more customized, local solution.
Using the POST /api/v1/apps/{appId}/export endpoint returns a "Location" header with the download URL for the exported app.
Third-party solutions
External tools that integrate with Qlik Cloud can also be used to back up apps. Please note that third-party solutions are not supported by Qlik Support.
Environment
- Qlik Cloud
-
Introducing new permissions for Qlik Automate
This article provides details about the new permissions available for Private automations, which will replace the previous Automation Creator role. ... Show MoreThis article provides details about the new permissions available for Private automations, which will replace the previous Automation Creator role.
You can assign these permissions to a custom role or the User Default. More information about creating & managing custom roles is available here.
The existing Automation Creator role will be deprecated later in 2026.
Private automations
These permissions allow users to run and create automations in their personal space.
Shared automations
Earlier in 2025, we introduced the shared automation permission that allows users to run, create, and manage automations in shared spaces in which they have the correct permissions. More information about which space roles are required for the various automation actions is available here:
-
How to download task event JSON files from Qlik Talend Cloud
Qlik Talend Cloud tasks do not offer logging at the task level for Storage and further downstream tasks. For those tasks, specifically, support may re... Show MoreQlik Talend Cloud tasks do not offer logging at the task level for Storage and further downstream tasks. For those tasks, specifically, support may request Task Event files to troubleshoot various issues, which are especially helpful for troubleshooting downstream tables that are in error or not progressing as expected. Often the event files from the impacted task and its source or predecessor task will be requested.
In this article, we will guide you through how to download the event logs:
- Navigate task's Monitor tab
- Place the mouse cursor in the space between the Run button and the task status (such as Running, Completed, Stopped), then:
- (on Windows) hold CTRL+ALT and double left-click the mouse
- (on Mac) hold Command+Option and double left-click the mouse
- The downloads will begin automatically and fetch four files:
For some tasks, the following pop-up will appear. Unless instructed otherwise by Support, click OK:
Environment
- Qlik Talend Cloud
- Navigate task's Monitor tab
-
How to get Talend Management Console task schedules and pause and resume during ...
This article explains how to obtain a task schedule in the Talend Management Console, how to pause it, and how to resume it. All steps are performed u... Show MoreThis article explains how to obtain a task schedule in the Talend Management Console, how to pause it, and how to resume it. All steps are performed using the API.
In the example, we use the following values:
- The Environment ID: 5b0431e2ee7c2b4082797c73
- Task ID: 698ba125c327f6c153585c67
- %TOKEN% is to be replaced by your actual bearer's token
- The API URL used in each example is set to the EU region, api.eu.cloud.talend.com. Update the region accordingly.
- The schedule is set from: 1772628971000 to 1775220971000, which is the 3rd of March 2026 to the 3rd of April 2026 in milliseconds since January 1st 1970. Use epochconverter.com to convert date and time to epoch time.
Content
Getting a task schedule
First, we get the scheduling of a task.
The following Qlik Talend API can be used to retrieve the executions scheduled in a time window using the "from" and "to" parameters: Get scheduled executions
Get scheduled executions of all types
POST /orchestration/executables/events/search
Example:
curl -v -X POST ^
-H  "Content-Type: application/json" ^
-H  "Accept: application/json" ^
-H  "Authorization: Bearer %TOKEN%" ^
-d "{\"environmentId\":\"5b0431e2ee7c2b4082797c73\",\"from\":\"1772628971000\",\"to\":\"1775220971000\"}" ^
https://api.eu.cloud.talend.com/orchestration/executables/events/search
The API returns a maximum of 100 entries by default. The parameter "offset" can be used to retrieve the next entries.
Example with "offset":
curl -v -X POST ^
-H  "Content-Type: application/json" ^
-H  "Accept: application/json" ^
-H  "Authorization: Bearer %TOKEN%" ^
-d "{\"environmentId\":\"5b0431e2ee7c2b4082797c73\",\"from\":\"1772628971000\",\"to\":\"1775220971000\",\"offset\":100}" ^
https://api.eu.cloud.talend.com/orchestration/executables/events/search
To retrieve all the entries, increase the "offset" value to the total value returned by the call that is lower than the limit value.
Pausing a task
Next, we pause the task.
The following Qlik Talend API can be used to pause a task: Pause / Resume a Task
Pause / Resume a Task
PUT /orchestration/executables/tasks/{taskId}/pauseExample:
curl -v -X PUT ^
-H  "Content-Type: application/json" ^
-H  "Accept: application/json" ^
-H  "Authorization: Bearer %TOKEN%" ^
-d "{\"pause\":true,\"pauseContext\":\"Pause during the maintenance window\"}" ^
https://api.eu.cloud.talend.com/orchestration/executables/tasks/698ba125c327f6c153585c67/pause
Resuming a task
We now set the task to resume.
The following Qlik Talend API can be used to resume a task: Pause / Resume a Task
Pause / Resume a Task
PUT /orchestration/executables/tasks/{taskId}/pauseExample:
curl -v -X PUT ^
-H  "Content-Type: application/json" ^
-H  "Authorization: Bearer %TOKEN%" ^
-d "{\"pause\":false}" ^
https://api.eu.cloud.talend.com/orchestration/executables/tasks/698ba125c327f6c153585c67/pause
Pausing and resuming a plan
To pause and resume a plan, the following Qlik Talend API can be used: Pause-Resume Plan executions
Pause-Resume Plan executions
PUT /orchestration/executables/plans/{planId}/pauseEnvironment
- Qlik Talend Cloud
- Qlik Talend Management Console
-
Newly created Qlik Talend Cloud users do not receive a notification email when a...
A newly created user in Talend Cloud may not receive the expected welcome email if the user was created in the Qlik Talend Management Console. Other ... Show MoreA newly created user in Talend Cloud may not receive the expected welcome email if the user was created in the Qlik Talend Management Console.
Other email notifications are received correctly, such as when resetting an existing user account.
Resolution
The issue is typically related to role permissions, email notification settings, or SSO configuration in the Qlik Talend Cloud Management Console.
- Verify User Role Permissions
The account used to create the new user must have the Infrastructure Administrator role. Without this role, the user creation may succeed, but notification emails will not be triggered. - Verify Email Notification Settings
Ensure that the “User has been created” notification is selected:
- Log in to Talend Cloud Management Console
- Go to Profile preferences and then the Notifications option
- Confirm that “User has been created” is selected
If this notification is not selected, no email will be sent when a new user is created.
- Check SSO Configuration (Important)
If Single Sign-On (SSO) is enabled for Talend Cloud, newly created users will not automatically receive activation emails.
To trigger the notification email:
- Temporarily disable SSO. SSO can be disabled by navigating to the Qlik Talend Management Console > Users > Authentication
- After disabling SSO, create the user
- Click "Send Invitation” to activate the user account
- Once SSO is disabled and the invitation is sent, the notification email will be delivered correctly.
Related Content
Environment
- Qlik Talend Cloud
- Qlik Talend Management Console
- Verify User Role Permissions
-
Migrating To Qlik Cloud Analytics
This Techspert Talks session covers: Demonstration of the Qlik Cloud Analytics Migration tool Advantages of Qlik Cloud SaaS Readiness Chapters... Show More
