Unlock a world of possibilities! Login now and discover the exclusive benefits awaiting you.
Analytics & AI
Forums for Qlik Analytic solutions. Ask questions, join discussions, find solutions, and access documentation and resources.
Data Integration & Quality
Forums for Qlik Data Integration solutions. Ask questions, join discussions, find solutions, and access documentation and resources
Explore Qlik Gallery
Qlik Gallery is meant to encourage Qlikkies everywhere to share their progress – from a first Qlik app – to a favorite Qlik app – and everything in-between.
Qlik Community
Get started on Qlik Community, find How-To documents, and join general non-product related discussions.
Qlik Resources
Direct links to other resources within the Qlik ecosystem. We suggest you bookmark this page.
Qlik Academic Program
Qlik gives qualified university students, educators, and researchers free Qlik software and resources to prepare students for the data-driven workplace.
Recent Blog Posts
-
Bit operators. How to operate with multiple values stored in one column
If you follow this blog then you know that during the last weeks we’ve been working in our Choose your champion app for the FIFA World Cup tournament... Show MoreIf you follow this blog then you know that during the last weeks we’ve been working in our Choose your champion app for the FIFA World Cup tournament happening in Russia.
Our data provider, Gracenote, populates and periodically updates several tables in a SQL database with all the tournament data.
As an example, just assume the Players table looks like this:
Player
Actions
Player A
145
Player B
17
Player C
139
The field Actions contain “compressed” information for 8 different actions during a game. The value 145 encapsulates all the information about Player A's performance during a certain game.
Combining multiple values into a single field
It is a frequent practice to combine multiple flag or binary columns into a single decimal column, instead of creating multiple columns to store these indicators.
One of the main advantages of this system versus the alternative of creating a column for each one of the actions is that if later we decide to record a new type of action we can just add it to the Actions column versus having to create a new column for each field.
But, how can I read what Actions column content actually means?
To do so we need more information. We need to know how that column is being created. For example, let’s assume we have this description of Actions column:
Actions Legend
game played = 1
goal scored = 2
penalty scored = 4
penalty missed = 8
1st yellow card = 16
2nd yellow card = 32
red card = 64
assists = 128
The above's data is the key to understand what’s stored in the Action column. To get a better view of it, let's convert the base 10 integer “Value”, to binary as in the expanded representation table below:
Player A (145)
Player B (17)
Player C (139)
Game played (1)
1
1
1
Goal scored (2)
0
0
1
Penalty scored (4)
0
0
0
Penalty missed (8)
0
0
1
1st yellow card (16)
1
1
0
2nd yellow card (32)
0
0
0
Red card (64)
0
0
0
Assist (128)
1
0
1
Binary flags representation:
Player
Binary
Decimal
Player A
10010001
145
Player B
00010001
17
Player C
10001011
139
Description:
Player A: played the game, got a yellow card and gave an assist to other player to score a goal.
Player B: played the game and got a yellow.
Player C: played the game, scored a goal, missed a penalty and assisted for a goal.
How to find what we are looking for?
To do so, it’s important to familiarize with the available bitwise or bit operators in Qlik:
Bitnot, bitand, bitor, bitxor , >>, <<
For more examples and further explanation you can check this page: https://en.wikipedia.org/wiki/Bitwise_operation
Continuing with the example, let’s try to find players that have scored a goal.
We need to check if the second bit is set, that means 00000010 (or integer 2 in base 10)
Player
Value
Value bitand 2
Player A
145
0
Player B
17
0
Player C
139
2
Select
  Player,
  Value
From PlayerTable where Value bitand 2 >0;
The statement above is selecting from PlayerTable where Value bitand 2 > 0. But, let's go row by row to see what's happening under the hood:
A bitwise AND takes two equal-length binary representations and performs the logical AND operation on each pair of the corresponding bits, by multiplying them. Thus, if both bits in the compared position are 1, the bit in the resulting binary representation is 1 (1 × 1 = 1); otherwise, the result is 0 (1 × 0 = 0 and 0 × 0 = 0)
Player A
10010001 (145 decimal)
bitand 00000010 (2 decimal)
---------
returns 00000000 (0 decimal)
Player B
00010001 (17 decimal)
bitand 00000010 (2 decimal)
---------
returns 00000000 (0 decimal)
Player C
10001011 (139 decimal)
bitand 00000010 (2 decimal)
---------
returns 00000010 (2 decimal)
Find the players who received a “Yellow Card” and did not “Assist”
We need to check if the fifth bit is set, 00010000 (or integer 16 in base 10) and if the eight bit is not set (128 base 10)
Player
Value
Value bitand 16
Value bitand 128 Player A
145
16
128 Player B
17
16
0 Player C
139
0
128 Select Player, Value From PlayerTable where Value bitand 16 > 0 and Value bitand 128 = 0;Bit operators in expressions
Remember you can use the bit operators to create expressions too, so in a object we could do:
=count(distinct {<Value = {"=Value bitand 16 > 0"}>} Player)This counts how many players have seen a yellow card so far, note how we are comparing the Value with the flag yellow card (16).
As you can see in the examples, the use of the bitand operator has allowed us to compare two different values at a binary level and returns whether the two numbers intersect allowing me to select and/or count the correct numbers.
Hope you find this interesting.
Arturo (@arturoqv)
PS: I'm attaching a QlikView and Qlik Sense app with the example data so you can test it out yourselves.

-
The Summer of Analytics!
The end of the school year is here, and while its time to enjoy a break, we believe its a better time to brush up on your analytic skills! According ... Show More
The end of the school year is here, and while its time to enjoy a break, we believe its a better time to brush up on your analytic skills! According to an article posted by Bloomberg "Job postings for data scientists rose 75 percent from January 2015 to January 2018 at Indeed.com, while job searches for data scientist roles rose 65 percent". That's a staggering number which seems to be increasing with every year that passes.
As a student, its important to act on this growing demand and make sure you have the skill set these employers are looking for.
Students graduating college who studied analytics and analytical tools are at a significant advantage over their peers who were not exposed to analytics and instead focused on more traditional learning. For example, according to staffing agency Robert Half Technology, "Jobs like data scientist pay about $119,000 at the midpoint of salaries and rises to $168,000 at the 95th percentile".
Don't get left behind, stay ahead of the game and make sure you continue your Qlik learning experience by taking advantage of all the FREE resources the program offers within the Qlik Continuous Classroom Academic Program Learning Resources
If its been a year since you last applied, we recommend re-applying for another year of new and improved resources including our Qlik Sense Qualification exam which will help you on your journey to one of those high paying positions mentioned in the Bloomberg article. The qualification exam gives student the opportunity to test their Qlik Sense skills in order to earn a badge which proves to employers they have basic skills and applied knowledge of Qlik. Hurry, reapply today https://www.qlik.com/us/company/academic-program
For more information on the this topic, visit the full article by Bloomberg https://www.bloomberg.com/news/articles/2018-05-18/-sexiest-job-ignites-talent-wars-as-demand-for-data-geeks-soars

-
AI the Qlik Way… Augmented Intelligence driving data literacy for everyone!
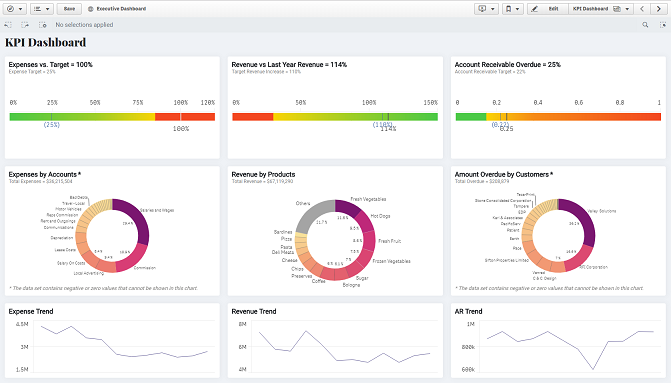
With the release of Qlik Sense June 2018, it is a good time to take a look at the AI advancements of Qlik Sense. At the core of all Qlik products ... Show MoreWith the release of Qlik Sense June 2018, it is a good time to take a look at the AI advancements of Qlik Sense. At the core of all Qlik products is the belief that analytics software should help to harness and extend the capabilities of the human user – driving data literacy for users of all skill levels. Our AI strategy centers on a new cognitive engine that works with our associative engine to provide insight suggestions and automation that are in context with user intuition and behavior.
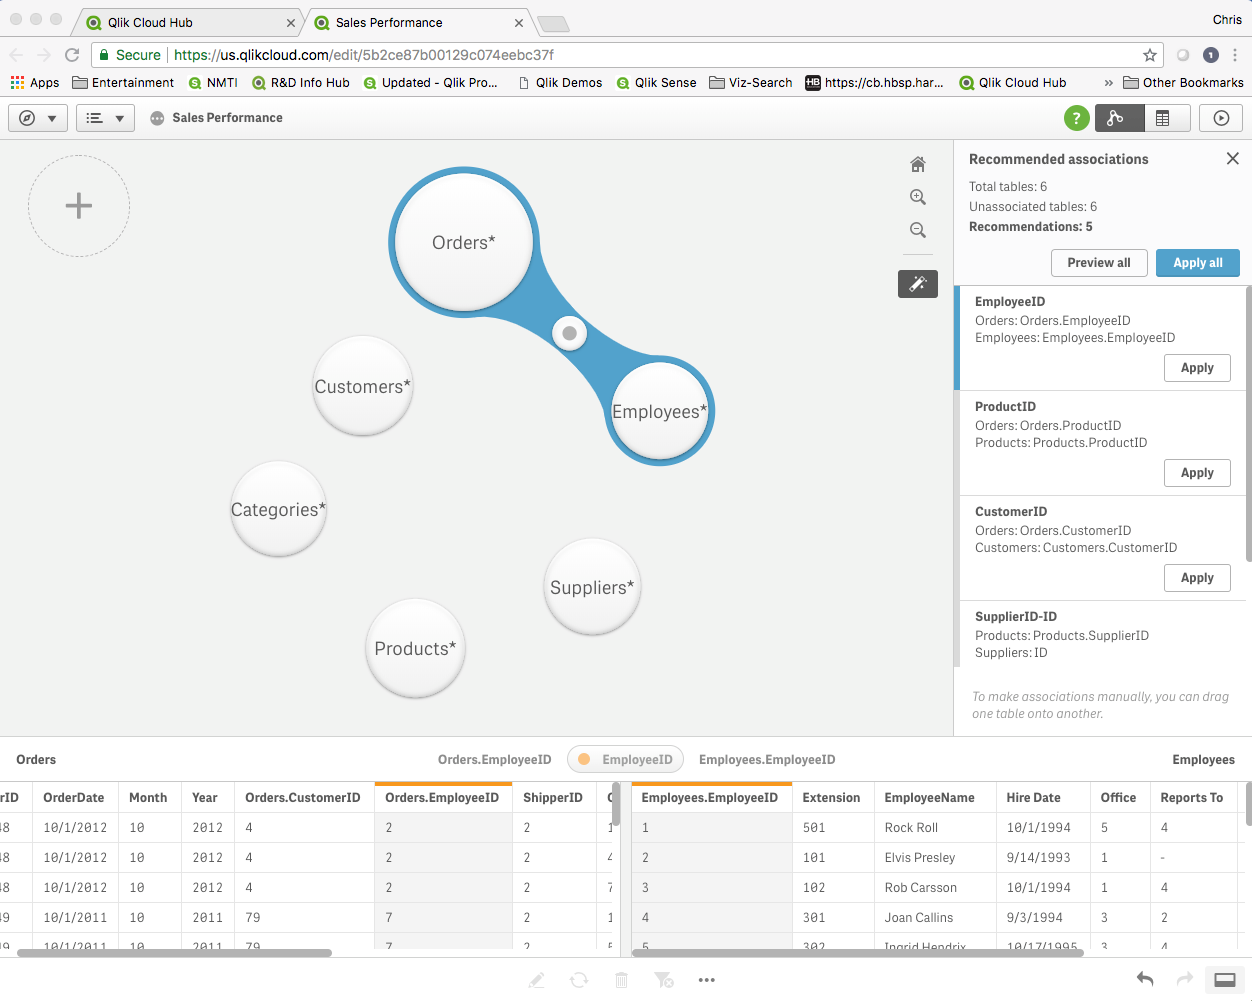
We started our AI journey in the February 2018 release with a new set of capabilities aimed at accelerating the self-service creation process through machine suggestions and automation, shortening the time-to-value from data to insight. The first step was to improve the process of linking multiple data sources together, where our Cognitive Engine now makes recommendations for the best associations based on the data sets being loaded.
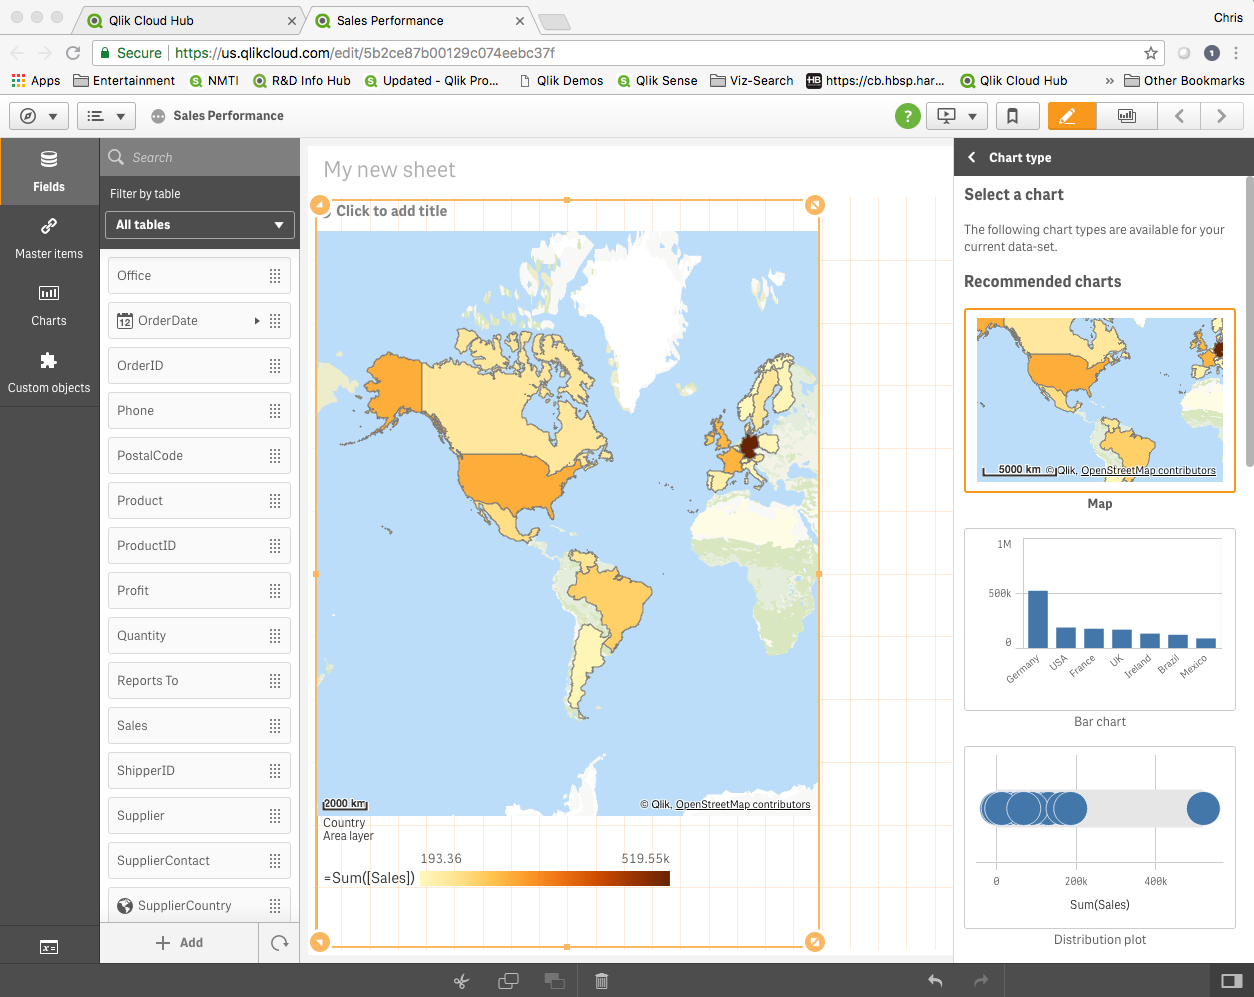
In the April 2018 release we continued this process by augmenting and accelerating the visualization process itself. A new chart suggestions capability leverages the cognitive engine to provide the best types of charts and visualizations based on the data being analyzed. This new “assist mode” automatically determines and renders the best chart types as users drag-and-drop dimensions to explore, and also renders a set of alternative chart suggestions for consideration, giving the user more choice in how they want to represent data. This requires the cognitive engine to understand data and associations and select the most appropriate visualizations to facilitate exploration and insight generation.
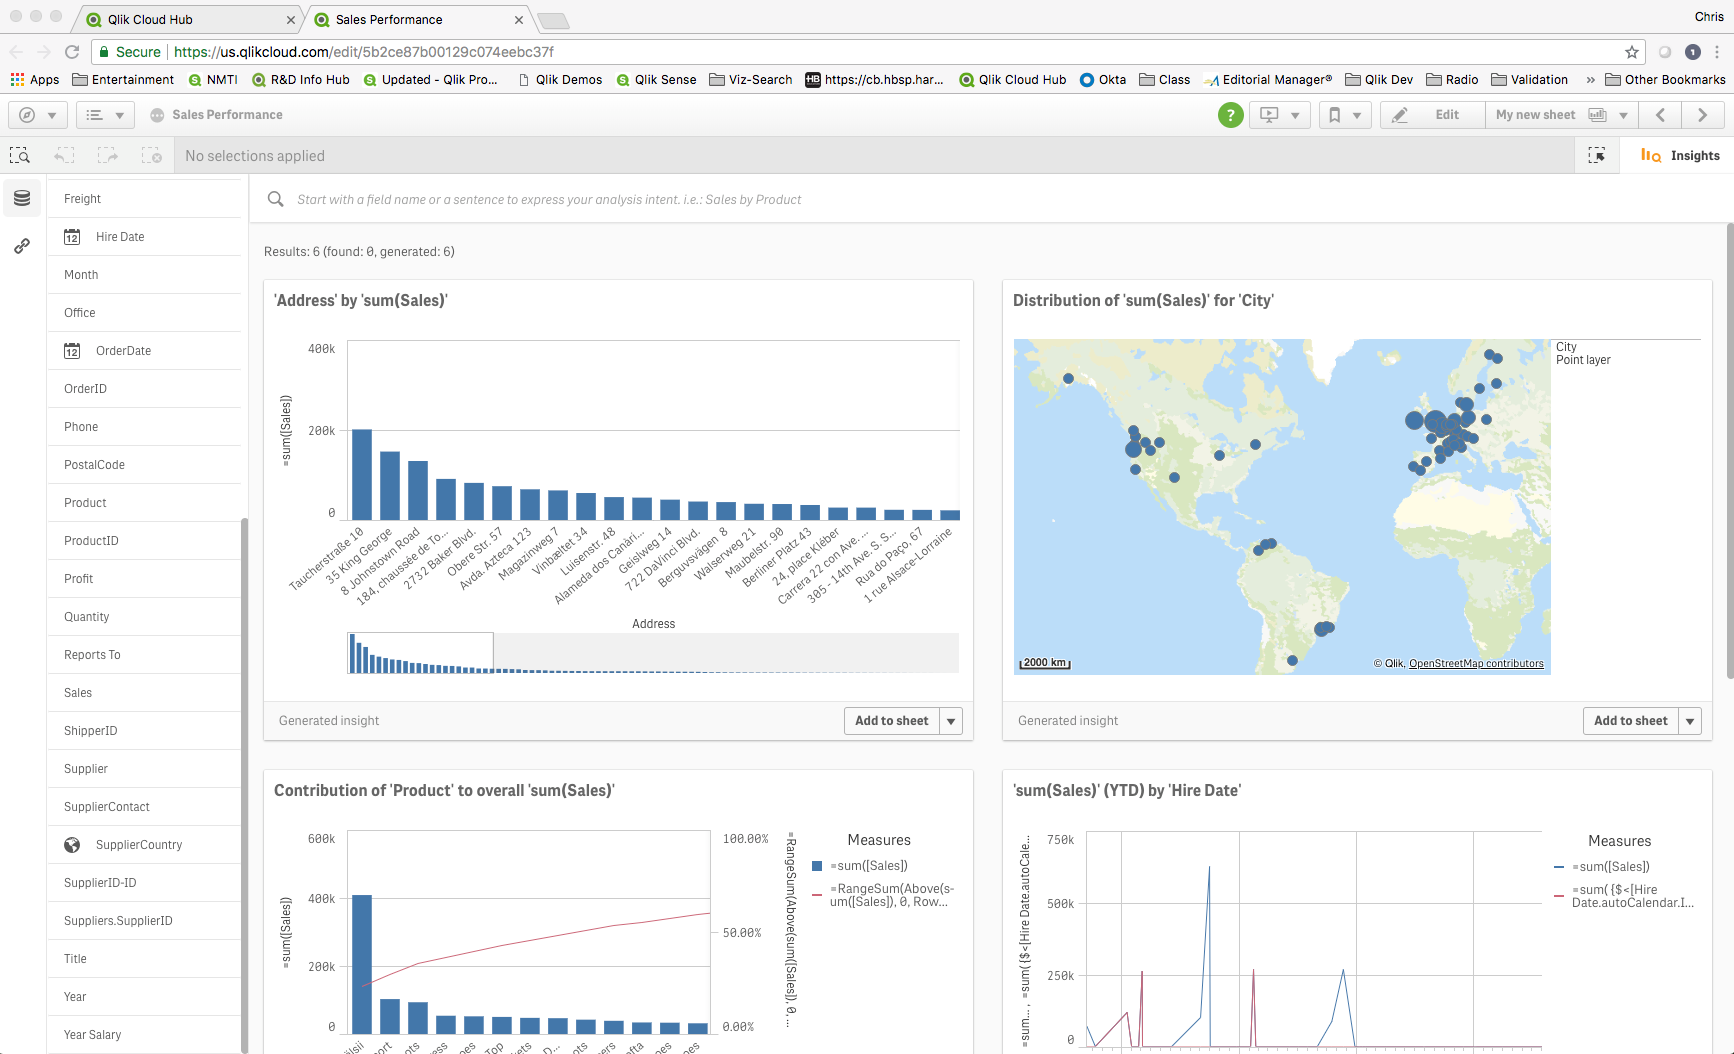
In June 2018 we took our augmented analytics capabilities to the next level with the introduction of the new Insight Advisor, again driven by our cognitive engine. The Insight Advisor provides the users with a new experience that auto-generates the most relevant charts and insights based on the overall data set, dimensional selections, and search criteria. This capability becomes even more powerful when combined with our associative engine, allowing users to spot insights in-context with their selections.
We hope you share our excitement around in these innovations that help to expand the accessibility and adoption of analytics for everyone, driving data literacy across your organization. And stay tuned for further innovations as our cognitive engine learns to better meet your analytics needs!
-
Smart Search: Creating the Index Before the First Search
This week I am honored to introduce our newest guest blogger, Laurie Chan-Lam. Laurie is one of our talented architects in Qlik R&D who has personally... Show More This week I am honored to introduce our newest guest blogger, Laurie Chan-Lam. Laurie is one of our talented architects in Qlik R&D who has personally worked on one of Qlik's unique and game changing capabilities, Smart Search. She recently was inspired by Mitul's blog post on Controlling Fields Shown in Smart Search - when encountering some questions regarding the possibility to create the Smart Search Index, BEFORE the actual search was initiated. (If you are not familiar with Qlik's Global and Visual Smart Search capabilities - you can review a few videos on the topic here)
Mitul's blog Controlling Fields Shown in Smart Search explains how you can configure what fields are searchable when creating the Search Index. So to recap, in order for the Smart Search capabilities to present the desired information to the user when using Smart Search, Qlik Sense needs to index it. With previous versions of Qlik Sense, the search index was created when first requested, therefore taking an additional amount of time before the results were displayed. Starting with Qlik Sense 3.1, you can now chose to create the search index at reload time as explained in the documentation by using the system variable CreateSearchIndexOnReload.
Follow these steps to learn more how to achieve this:
How can I turn on/off the creation of the search index at reload time?
In order to turn on the creation of the search index at reload time, several criteria need to be met:
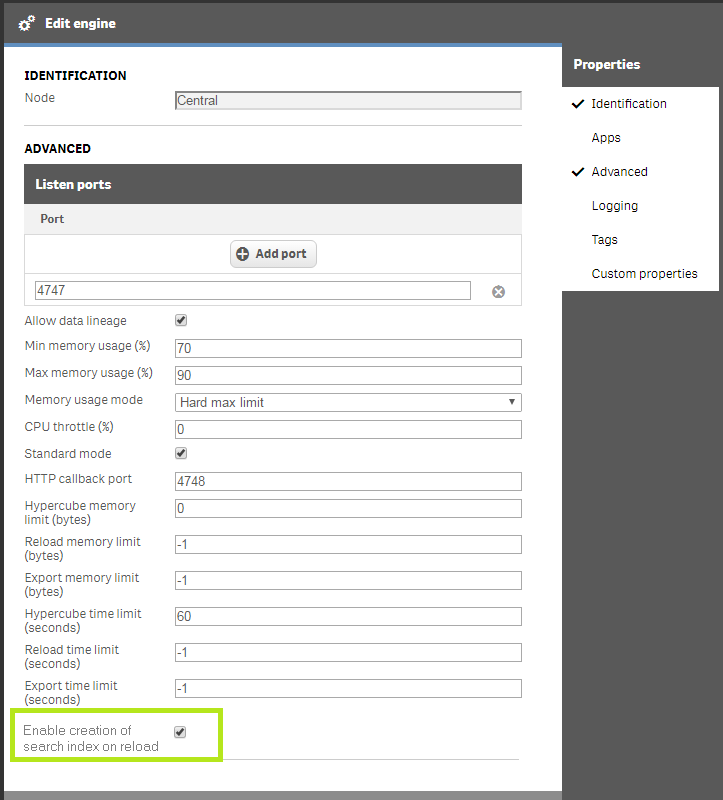
- The Engine needs to be enabled to support the creation of search index at reload time. This can be done via a setting in the QMC. (Qlik Management Console)
- Go to menu items Engines
- Edit the node you want to work on
- Tick the Advanced menu
- Tick the "Enable creation of search index on reload" box
Then in the app in the Data Load script:
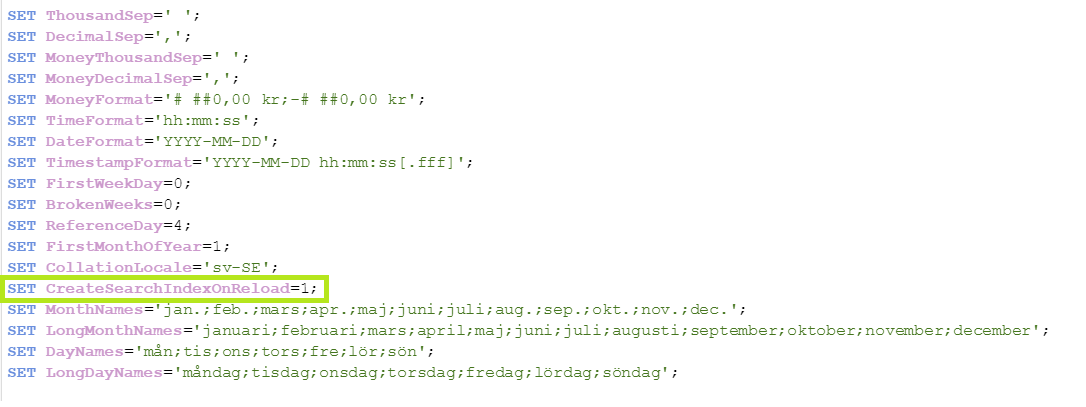
The app needs to have the System Variable Set CreateSearchIndexOnReload=1; This statement exists by default in Qlik Sense. Note that the statement of Set CreateSearchIndexOnReload=0; will allow the user to delay the creation of the search index at search time.
Why should I create the search index at reload time?
Creating the search index at reload time makes the search index ready from the first use. Therefore there is no need to wait for the index to be created. The first use of Smart Search after the initial reload will be as fast as the following ones.
Some exceptions:
Session apps
By definition, session apps are not persisted. Therefore, the corresponding search index shouldn't be persisted and Qlik Sense doesn't index at reload time for session apps.
Synchronized persistence
If the reload node is not the node on which the user is searching, then the creation of the search index on the reload node needs to be disabled. If you do not disable this, an index is created when you reload, which consumes time and disk space to no advantage
Thank You for reading.
Laurie Chan-Lam
Qlik Architect

- The Engine needs to be enabled to support the creation of search index at reload time. This can be done via a setting in the QMC. (Qlik Management Console)
-
How we built Choose Your Champion
The biggest tournament in soccer is in full swing today, and if you haven't checked out our Choose Your Champion demo app, take a second to check it o... Show More
The biggest tournament in soccer is in full swing today, and if you haven't checked out our Choose Your Champion demo app, take a second to check it out now Choose Your Champion. We've gotten some questions about how we built it, so I'm going to go through a high-level summary. Before we begin, note that there's really two parts of the Choose Your Champion app, the Create a Bracket part, and the Historical Analysis part, which we really took two different approaches for.
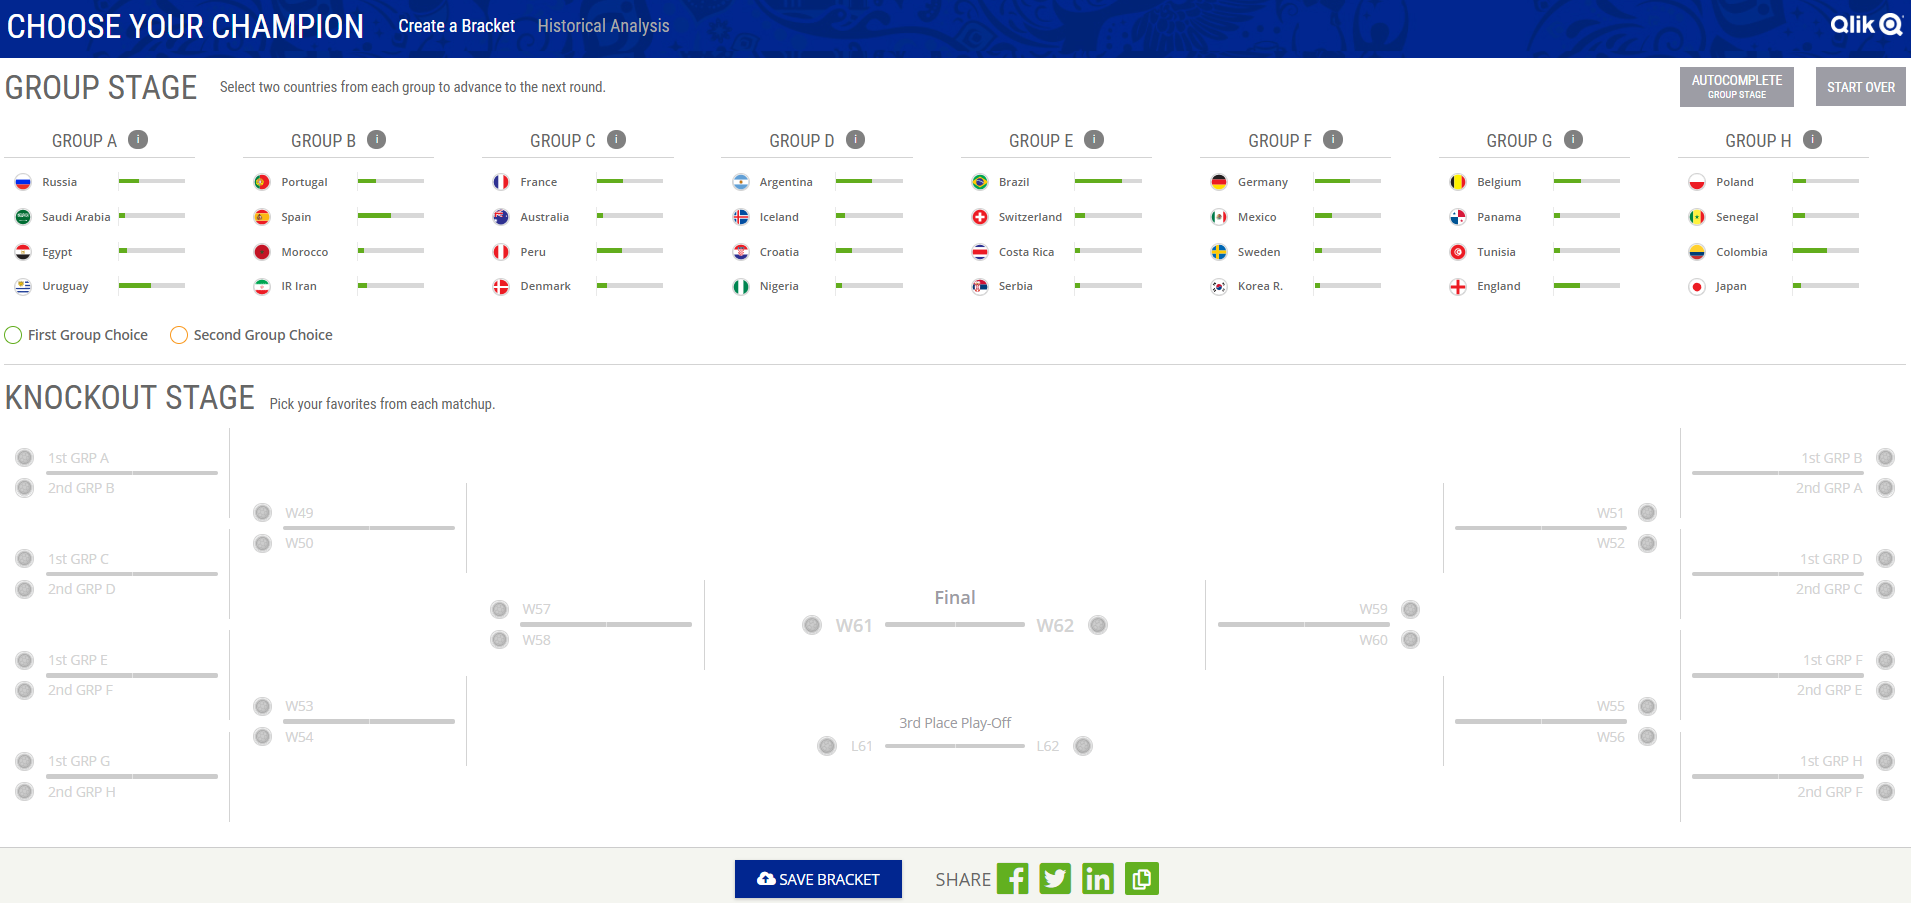
Create a Bracket
For the “Create a Bracket” half of the Choose Your Champion app, we connect to a Qlik Sense app with enigma.js on page load. We get all the data we need from Qlik Sense using Qlik expressions and pagination to select from the associated data, which is fast and easy. The data we get from Qlik Sense we then put into a Redux store, and manage state from there. We decided this was the best approach for this part of the app for us for quite a few reasons, but it would be pretty trivial to have Qlik Sense manage all the state here if desired with a few Qlik Sense variables and a bit of set analysis.
Once we have the data from Qlik Sense saved in a Redux store, we just use html, css, and javascript to build the bracket and charts. Any selections the user makes just updates the Redux store. The charts here really are very simple, just some divs with conditional widths/heights. We allow the user to authenticate with Facebook and save their bracket, which we just save to a database, and fallback to localstorage to save the state if the user isn’t authenticated or hasn’t yet saved a bracket.
And this really demonstrates the power and flexibility of Qlik Sense APIs. We can easily get the data we need, and then do whatever we’d like with it.
 Historical Analysis
The “Historical Analysis” half of the Choose Your Champion app is probably a more familiar Qlik Sense experience. We connect to the app using our qdt-components library so we have access to our prebuilt QdtSelectionToolbar component and then also built a custom filter and table component (fun fact: the bar chart is also the custom table component, with a few special props). We also connect to the Visualization API using qdt-components to create and embed some native Qlik Sense visualizations.
That’s really it, this part of the app is pretty straightforward.
A few comments
Somebody had asked if the custom visualizations were extensions, and the answer is no, there are no extensions used here. While Qlik Sense extensions are great if you want to reuse them across multiple apps, or enable non-developers to create the objects in the Qlik Sense client, if you don’t have those requirements it’s easier to just build some components that interface with the Qlik Sense engine but don’t have to worry about being extensions. This also means those components can be used in other projects where you may not be connecting to the Visualization API and you won’t have to load all of the assets required to use the Visualization API.
And that’s it. Like I already stated, I think this demo shows the power and flexibility of the Qlik Sense APIs and what is possible with them, and I hope there’s something to take away for everyone here. If you guys have any questions about any of it, let me know.
-
The Qlik Academic Program Partners with Universities in Australia to Drive Data ...
Qlik is excited to announce the increase in Australian universities joining the Academic Program in recent years! To showcase the tremendous growth a... Show More
Qlik is excited to announce the increase in Australian universities joining the Academic Program in recent years! To showcase the tremendous growth and excitement the country has experienced, Qlik has just launched a press release highlighting several Australian universities. The press release touches upon the programs resources, its quest to make every student data literate, and the benefits seen to both professors and students. There are some fantastic quotes from professors and students that capture the overall support and appreciation there is for what the program provides.
The press released was picked up by numerous technology company websites, to read the full article visit https://www.cio.com.au/mediareleases/31785/qlik-partners-with-universities-in-australia-to/
If you are a professor or student we HIGHLY recommend you visit The Qlik Academic Program
to learn more about this amazing and FREE program and apply!
-
The Academic Program takes over Australia!
We are so excited to announce the increase in Australian universities joining the Academic Program in recent years! To showcase the tremendous growth... Show More We are so excited to announce the increase in Australian universities joining the Academic Program in recent years! To showcase the tremendous growth and excitement the country has experienced, Qlik has just launched a press release highlighting several Australian universities. The press release touches upon the programs resources, its quest to make every student data literate, and the benefits seen to both professors and students. There are some fantastic quotes from professors and students that capture the overall support and appreciation there is for what the program provides.
The press released was picked up by numerous technology company websites, to read the full article visit
https://www.cio.com.au/mediareleases/31785/qlik-partners-with-universities-in-australia-to/
-
Prepare for the Machine-Aided Future
Intelligent automation is going to impact companies and individuals in profound ways, some of which are not yet foreseeable. Unlike traditional automa... Show More
Intelligent automation is going to impact companies and individuals in profound ways, some of which are not yet foreseeable. Unlike traditional automation, which lacks an AI element, intelligent automation will automate more kinds of tasks in an organization, at all levels within an organization.
As history has shown, rote, repetitive tasks are ripe for automation. Machines can do them faster and more accurately than humans 24/7/365 without getting bored, distracted or fatigued.
One type of automation is data analysis. Gone are the days where you pine over sheets of excel data. Now a days companies use data analytics applications to quickly and accurately analyze and predict their data in a matter of minutes. But who is building the applications? A human touch is still needed to program these apps so that they can take over the manual data analysis. Therefore, at this time its crucial that students are keeping up with the need to learn data analytics. The Qlik Academic Program fills this need by providing FREE software, training, the chance to take a qualification exam to prove their Qlik analytics skills, and much more! All students need to do it visit https://www.qlik.com/us/company/academic-program and apply to the student application!
To read the full article visit
-
The QlikView Cache
QlikView has a very efficient, patented caching algorithm that effectively eliminates the calculation time for calculations that have been made before... Show MoreQlikView has a very efficient, patented caching algorithm that effectively eliminates the calculation time for calculations that have been made before. In other words, if you use the “back” button in the toolbar, or if you happen to make a selection that you have made before, you usually get the result immediately. No calculation is necessary.
But how does it work? What is used as lookup ID?
For each object or combination of data set and selection or data sub-set and expression QlikView calculates a digital fingerprint that identifies the context. This is used as lookup ID and stored in the cache together with the result of the calculation.
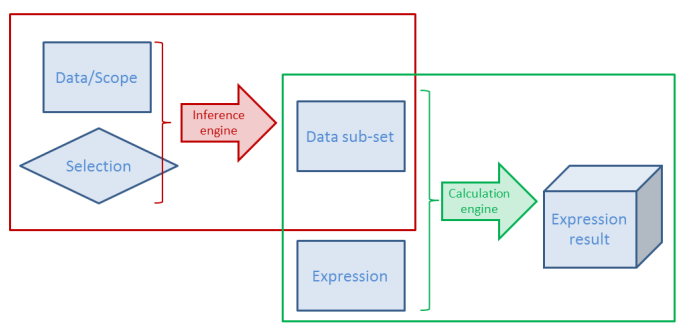
Here "calculation" means both the Logical Inference and Chart calculation - or in fact, any expression anywhere. This means that both intermediate and final results of a selection are stored.
There are some peculiarities you need to know about the cache…
- The cache is global. It is used for all users and all documents. A cache entry does not belong to one specific document or one user only. So, if a user makes a selection that another user already has made, the cache is used. And if you have the same data in two different apps, one single cache entry can be used for both documents.
- Memory is not returned, when the document is unloaded. Cache entries will usually not be purged until the RAM usage is close to or has reached the lower working set limit. QlikView will then purge some entries and re-use the memory for other cache entries. This behavior sometimes makes people believe there is a memory leak in the product. But have no fear – it should be this way. So, you do not need to restart the service to clear the cache.
- The oldest cache entries are not purged first. Instead several factors are used to calculate a priority for each cache entry; factors like RAM usage, cost to calculate it again and time since the most recent usage. Entries with a combined low priority will be purged when needed. Hence, an entry that is cheap to calculate again will easily be purged, also if it recently was used. And another value that is expensive to recalculate or just uses a small amount of RAM will be kept for a much longer time.
- The cache is not cleared when running macros which I have seen some people claim.
- You need to write your expression exactly right. If the same expression is used in several places, it should be written exactly the same way – Capitalization, same number of spaces, etc. – otherwise it will not be considered to be the same expression. If you do, there should be no big performance difference between repeating the formula, referring to a different expression using the label of the expression or using the Column() function.
The cache efficiently speeds up QlikView. Basically it is a way to trade memory against CPU-time: If you put more memory in your server, you will be able to re-use more calculations and thus use less CPU-time.
Further reading on the Qlik engine internals:
Symbol Tables and Bit-Stuffed Pointers

-
Are you using data as a competitive weapon?
Data is a company’s most powerful, yet most underutilized and poorly managed asset. Companies that strive to get ahead of the pack in today’s world ne... Show More
Data is a company’s most powerful, yet most underutilized and poorly managed asset. Companies that strive to get ahead of the pack in today’s world need to capture, create, and leverage value from their data by making data-driven decisions with it. But how do they do that? This is the first of a multi-part blog series to help answer that question. In this post, we will introduce a framework you can leverage. We will dive into each section of the framework in more detail in subsequent posts. To read the full blog visit Are you using data as a competitive weapon? | Qlik Blog
As a student, its vital that you have the data literacy skills and experience with Qlik in order to be prepared to make the difficult decisions that employers are expecting. The Academic Program together with the Data Literacy program will ensure you are prepared for the current workforce which relies heavily on analytics! Be prepared! If its been more than a year since you applied to the program, you should reapply to ensure you have another year of our amazing resources! To apply visit http://www.qlik.com/us/company/academic-program
-
Relative Calendar Fields
A common question in the QlikCommunity forum is how to show only the last N months. The suggested answers are most of the time relatively complex set ... Show MoreA common question in the QlikCommunity forum is how to show only the last N months. The suggested answers are most of the time relatively complex set analysis expressions including dollar expansions with aggregation functions, e.g.
Sum( {$<Date={">=$(=MonthStart(AddMonths(Max(Date),-12)))<$(=MonthEnd(Max(Date)))"}>} Sales)
Such an expression may work fine. However, it is not simple. When seen by someone who didn't write it, it is almost incomprehensible. So instead of such an expression, I would like to suggest a slightly different method: Relative calendar fields.
The idea is to define relative calendar fields in the master calendar. By doing this, it will be a lot simpler to define chart expressions. For example, you can in your master calendar define fields calculating how many days or months ago a specific date was:
Today() - Date as DaysAgo,
12*(Year(Today())-Year(Date)) + Month(Today()) - Month(Date) as MonthsAgo,Then you will be able to have much simpler chart expressions, e.g:
Sum({$<MonthsAgo={">=0<12"}>} Sales)
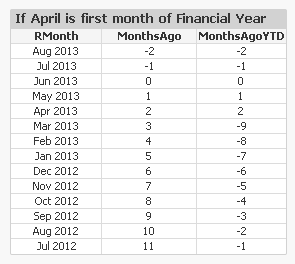
This expression does almost the same as the initial expression. But it is much easier to read and understand. Below you have a chart using this expression showing the last 12 months. (Financial year that starts in April; today is a day in June and the dimensions are rolling month [Date(MonthStart(Date),'MMM')] and fiscal year.)

Further, you can also create fields for relative months within the financial year; fields that you can use for a year-on-year comparison:
Today() - YearStart(Today(),0,$(vFM)) - Date + YearStart(Date,0,$(vFM)) as DaysAgoYTD,
Mod(Month(Today())-$(vFM),12) - Mod(Month(Date)-$(vFM),12) as MonthsAgoYTD,The variable vFM is the first month of the financial year, see more on Fiscal Year.
If you have these fields defined, you can easily make a year-to-date chart comparing the different years. The expression will be the same as before, but with MonthsAgo changed to MonthsAgoYTD:
Sum({$<MonthsAgoYTD={">=0"}>} Sales)
Below you have a chart of a year-over-year comparison (using the built-in accumulation):
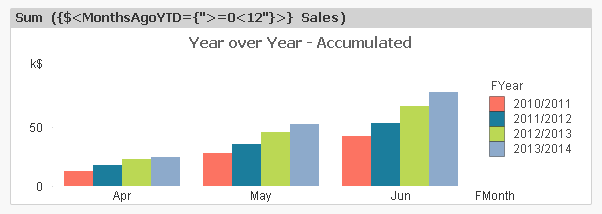
Bottom line: By defining relative dates and months in your master calendar, you can significantly simplify your set analysis expressions. Also, such fields will help your users create new charts. And your charts may even evaluate faster...
Simplicity.
-
Failure is our Friend
In his latest post, Jordan Morrow explains why failure is key to success with Data Literacy: Failure is our Friend | Qlik Blog
-
Refreshing File-based Data and the New Dropbox Connector - Qlik Sense Cloud Busi...
Good day Qlik Community! In this article / video - I'm excited to present to you a preview of the new Dropbox connector that comes with Qlik Sense Clo... Show More Good day Qlik Community! In this article / video - I'm excited to present to you a preview of the new Dropbox connector that comes with Qlik Sense Cloud Business and Qlik Sense Enterprise, available later this month. In short, Qlik Sense can now securely access Dropbox and pull data from Qlik Sense supported file sources, directly from the cloud share. The connector itself, is fairly simple to use. It's just like accessing a local folder structure. However, it gives you another option for storing data files for use with your Qlik Sense apps. It even opens some new techniques for refreshing file-based used by those apps. So, instead of storing data files in my Qlik Sense Cloud Workspace, I can choose to store them in Dropbox. With this approach I can automate a data file upload process when new data arrives..... add that to Qlik Sense Cloud Business and its Schedule Data Refresh capability, and you can completely automate the data upload and Qlik Sense app refresh process!
Want to learn more? Take a look at this brief video below to see how I used the Qlik Sense Dropbox connector and common, freely available Windows tools to make this happen.
NOTE: The approach I take in the video simulates data being written out / updated to disk and then transferred to Dropbox on an automated schedule using a 3rd party scheduler (Windows Task Scheduler). It is completely up to you how you would like to achieve this. For example, you could have a database process export files directly to the Dropbox folder, or even use an ETL tool workflow and its scheduler to write out data to the Dropbox share.
Have more ideas on how this can be achieved? We want to hear from you, so share them in the comments below.
Regards,
Michael Tarallo (@mtarallo) | Twitter
Qlik
Qlik Sense Cloud Business - Dropbox Connector - Refreshing file-based data
NOTE: To increase resolution or size of the video, select the YouTube logo at the bottom right of the player. You will be brought directly to YouTube where you can increase the resolution and size of the player window. Look for the 'settings' gears icon in the lower right of the player once at YouTube
Can't see the YouTube video?
Download it here to watch on your computer or mobile device?
-
The Cloudera Data Lake Explorer
Our David Freriks is back introducing a free, open source utility that provides a visual exploration front end that helps you understand the “big data... Show MoreOur David Freriks is back introducing a free, open source utility that provides a visual exploration front end that helps you understand the “big data” that exists inside the Cloudera data lake. It allows a user to visually understand how to create fully interactive Qlik apps on the data of interest to them.
Cloudera Data Lake Explorer is Qlik Associative Engine API based application that leverages metadata from Cloudera (Impala, Navigator, Manager) to browse the width of the data lake and build a self-service Qlik Sens application with no scripting required. The explorer interface uses the power of the Qlik Associative Engine to show how all the metadata correlates between databases, tables, columns, metadata tags, and sql queries. Watch the video below to learn more.
This application has been published to Qlik Branch (http://branch.qlik.com/#!/project/5afb0d76fefa01686177560d ) and is hosted on Github. The Cloudera Data Explorer is a new take on how to use the power of Qlik to navigate, understand, and leverage big data in a way that simplifies the experience for the exploratory user.
Regards,
David Freriks (@dlfreriks) | Twitter
Qlik
David is a Technology Evangelist on the Innovation and Design team at Qlik. He has been working in the "big data" space for over three years, starting with Hadoop and moving onto Spark in this continuously evolving ecosystem. He has 18+ years in the BI space, helping launch new products to market.
-
Introducing qdt-theme
On the demo team we have been very busy lately working in some cool stuff for the community, qdt-components is a notable example of our commitment and... Show MoreOn the demo team we have been very busy lately working in some cool stuff for the community, qdt-components is a notable example of our commitment and contributions to the Qlik Community.
With the announcement of the new theme capabilities that were added to Qlik Sense in the February release we wanted to extend our involvement with you by sharing a custom theme we developed internally.
The qdt-theme is a curvy, bolder theme that significantly modifies the default look of Qlik Sense Desktop. Our goal was to create an appealing theme that you all can use right away, but more importantly we wanted it to be a theme for you to modify and extend as well.
In qdt-theme we changed font types, font sizes and a variety of styles including the current selection bar to make it fit in the new color scheme. Also, we incorporated lots of color palettes (borrowed from other themes, thank you) so you have a wild variety of schemes to choose from.
You can check out the qdt-theme library at our Demo Team's GitHub: https://github.com/qlik-demo-team/qdt-theme.
Hopefully you find it useful.
Enjoy it!
-
Qlik Sense® will release 5 times a year!
Did you hear the news? Qlik® is introducing a continuous release process for Qlik Sense®. Instead of three releases per year with a dot-zero release ... Show MoreDid you hear the news? Qlik® is introducing a continuous release process for Qlik Sense®.
Instead of three releases per year with a dot-zero release in June, Qlik will begin releasing Qlik Sense® every 10 weeks! Since each release will be similar in scope, we are also replacing our number-based naming convention with releases identified by the month and year they were distributed. This means that instead of Qlik Sense® 4.0, the June release will simply be called Qlik Sense® June 2017. (Most other Qlik products will also follow a similar cadence going forward as well.)
With releases five times per year, it might be difficult to stay up to date on what’s new. To help, we are making a number of changes to help keep you informed. This blog area is just the start.
Another important opportunity for you to learn about each release is to participate in the release preview process.
A release preview is an early release of our software which is very close to reaching general availability (GA). It provides the opportunity to try out new features and to test your internal processes on a version of the software that is nearly perfect. Within a few weeks, the official version will then be released and you can move onto that one with confidence.
As release previews become available, they will be posted to the Product Insight area of community. If you are logged into your QlikID, you should find a release preview for both the June release of Qlik Sense as well as Qlik NPrinting™ .
You will want to 'follow' the product insights page so that you are notified immediately of any new previews. If you have any trouble with access, please contact insight@qlik.com
-
Data Literacy Takes the Stage
Did you hear? Data Literacy made a big splash at Qonnections last week! We unveiled our brand new education program for Data Literacy, and supported... Show More
Did you hear? Data Literacy made a big splash at Qonnections last week! We unveiled our brand new education program for Data Literacy, and supported the launch with many exciting activities. Our global head of the program Jordan Morrow recaps it all for you right here: Data Literacy Takes the Stage | Qlik Blog
-
An Introduction to Leonardo UI
What is Leonardo UI?Leonardo UI was introduced with Qlik Sense 3.0. Here's a description from the documentation -Leonardo UI is a UI component frame... Show MoreWhat is Leonardo UI?
Leonardo UI was introduced with Qlik Sense 3.0. Here's a description from the documentation -
Leonardo UI is a UI component framework, designed to be used as a complement to other frameworks. It is non-obtrusive in the sense that it contains no global styling but will use your page defaults. You can also use it standalone with a CSS reset to get consistent styling of your components.
How can I use Leonardo UI?
Leonardo UI is available to use in Qlik Sense mashups, extensions, and widgets as of Qlik Sense 3.0, and you do not have to do anything extra to begin using it in those contexts.
The documentation for it is here - Leonardo UI, and I've added to that by providing examples of the currently available components and listing all available icons here - Leonardo UI Examples and Icons
-
Introducing Qlik Core® - Beta
Imagine having a suite of proven tools and technologies built for developers by developers that allows you to build highly-scalable, cloud ready solut... Show More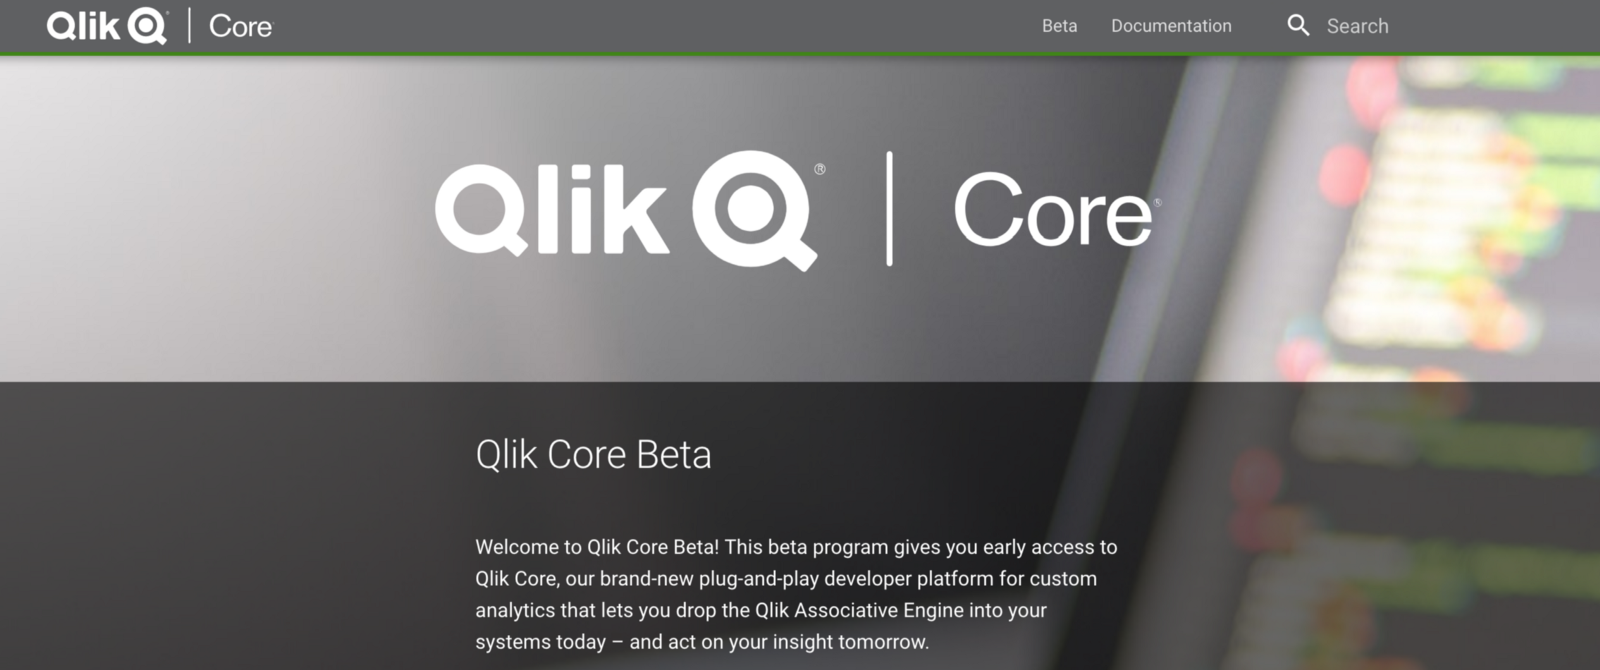 Imagine having a suite of proven tools and technologies built for developers by developers that allows you to build highly-scalable, cloud ready solutions using the power of the Qlik Associative Engine. Well, imagine no longer last Friday, 4/6, we released the Beta of Qlik Core. Qlik Core is a development platform built on top of the Qlik Associative Engine. With Qlik Core, you can take advantage of the powerful associative indexing engine from Qlik to build your custom data exploration and data visualization solutions.
Please note that Qlik Core is a product - but it is not something you simply download and install with an installer. It works with technologies such as Node.js, Docker and Kubernetes and development knowledge of working with APIs is a prerequisite. To learn more about the Qlik Core Beta and to get started watch this brief video below and visit https://branch-blog.qlik.com/introducing-qlik-core-beta-30221d627132 - where our product manager John Trigg provides some more of the particulars. You can also visit the many getting started resources here https://qlikcore.com/.
This brief video below is a short promotional video designed to briefly introduce Qlik Core.
Introducing Qlik Core
Regards,
Michael Tarallo (@mtarallo) | Twitter
Qlik
Can't see the video? YouTube blocked by your region or organization? Download the .mp4 to view on your computer or mobile device.
-
On Format Codes for Numbers and Dates
Numbers and dates are a never-ending source of concern when building any BI solution.But in QlikView, there is always a way to solve a problem… First,... Show MoreNumbers and dates are a never-ending source of concern when building any BI solution.
But in QlikView, there is always a way to solve a problem… First, QlikView can interpret and format numbers and dates using functions in the script:
Alternatively, it can format them in the user interface, where each object, dimension or expression potentially can have its own number formatting:
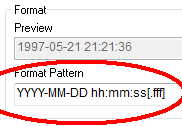
The common denominator for interpretation and formatting in QlikView is the Format Code. QlikView uses it as a parameter in many functions, and you can find it in the Format Pattern on the Number tab in the properties dialog.
Some rules of thumb around the format codes:
- Unrecognized characters in the format code can prevent QlikView from interpreting a number.
- The codes are case sensitive. For instance, M means month, whereas m means minutes. Some symbols can be written in either upper or lower case, e.g. AM/PM (or am/pm) and XIV (or xiv). For these, the format code must correspond to what you want: TT for AM/PM; tt for am/pm; (ROM) for XIV and (rom) for xiv.
- With the format code you can force a rounded display, e.g., by specifying two decimals on a multi-decimal number or by specifying year and month, but not day, when displaying a date. Such a rounding will only change the display and not the underlying number. To change the numeric value, you need to use a rounding function, e.g., Round(), Ceil() or MonthStart().
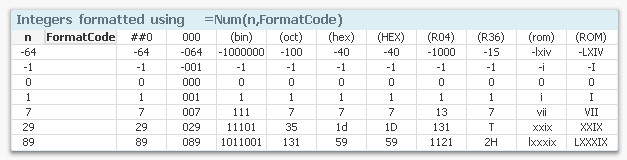
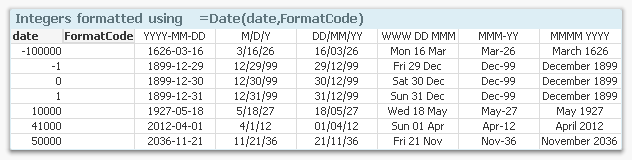
You can specify Integers to have leading zeros. You can also specify them as binary, octal, decimal and hexadecimal numbers. In fact, you can use any radix from 2 to 36. You can also format them as Roman numerals.
Num( Number, '000000' ) as Number // Always with at least 6 digits. Leading zeros!
Num( Number, '(R36)' ) as Number // Displayed in Radix 36 (like hex, but with 36 symbols)
Num( Number, '(ROM)' ) as Number // Upper case Roman numeralsSee picture below for the different cases. Each column denotes a specific format code. The rows are examples of input numbers and how QlikView will format them.
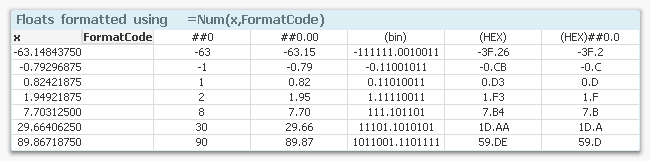
Float numbers are similar. If you need QlikView to interpret a number that has a decimal symbol different from the one in the environment variables, be sure to use the third and fourth parameters of the Num#() function to specify decimal character and thousand separator. A correct format code is not enough.
Num#( Number, '0,0', ',' , '.' ) as Num // Number with decimal comma and point as separator
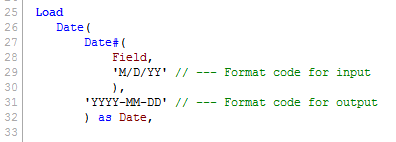
QlikView interprets the integer part of a date serial number as a date – the number of days from Dec 30, 1899. Date formats are different from country to country so you sometimes need to specify which format you want. Note that you can specify weekday also..
Date( MonthStart( date ), 'YYYY MMM' ) as YearMonth
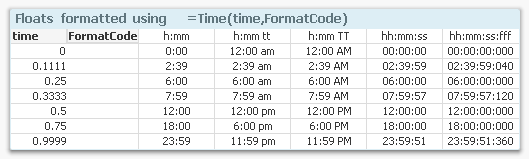
QlikView interprets the fractional part of a date serial number as time of day. This can be specified in hours and minutes, etc. Note that the TT symbol denotes AM/PM. If this is not used, QlikView will assume 24-hour notation.
Time( Ceil( Time, 1/24/4 ), 'hh:mm' ) as Time // Time rounded downwards to nearest 15 min
I recommend that you use interpretation, rounding, and formatting functions in the script to transform data into a form that you want.
HIC
Further reading related to this topic:


