- Mark as New
- Bookmark
- Subscribe
- Mute
- Subscribe to RSS Feed
- Permalink
- Report Inappropriate Content
How do I change the format of the date x-axis in a line chart?
My date format is displayed as MMMYY in my tables in data manager. But when I use this date field as my dimension in a line chart the date appears as dd.mm.yy.00:00:00 on the x-axis. How do I change this format as I can't find the option in properties.
- Mark as New
- Bookmark
- Subscribe
- Mute
- Subscribe to RSS Feed
- Permalink
- Report Inappropriate Content
Привет Laurelly,
К сожалению, я не мог воспроизвести вашу ситуацию (см прикрепленный файл). Вы можете разделить файл QVF с фрагментом данных?
С Уважением,
Андрей
- Mark as New
- Bookmark
- Subscribe
- Mute
- Subscribe to RSS Feed
- Permalink
- Report Inappropriate Content
Hi Laurelly,
You have two options:
a) Use in your chart: date(DATE_FIELD,'DD/MM/YYYY')
b) If you don´t want to show never hours/minutes/seconds. In you script use
date(DATE_FIELD, 'DDMMYYYY') as DATE_FIELD
Regards
Miguel del Valle
- Mark as New
- Bookmark
- Subscribe
- Mute
- Subscribe to RSS Feed
- Permalink
- Report Inappropriate Content
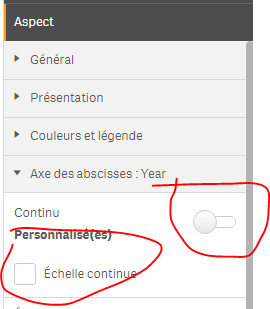
In the line chart, under aspect, under x-axis, uncheck the "continue" axis:
- Mark as New
- Bookmark
- Subscribe
- Mute
- Subscribe to RSS Feed
- Permalink
- Report Inappropriate Content
Try This,
DATE(TIMESTAMP(DATE_FIELD),'MMM-YY')
- Mark as New
- Bookmark
- Subscribe
- Mute
- Subscribe to RSS Feed
- Permalink
- Report Inappropriate Content
No this doesn't work for me (a complete newbie).
When I try your suggestion, I get the following, i.e. the label changes, but the dates are still in numeric (days since 1900) format, even though the incoming data is seen in the Data tables as YYYY-MM-DD hh:mm:ss
