Unlock a world of possibilities! Login now and discover the exclusive benefits awaiting you.
- Qlik Community
- :
- Discover
- :
- Programs
- :
- Education
- :
- Qlik Education Discussions
- :
- Re: dashboard for every row in the table
- Subscribe to RSS Feed
- Mark Topic as New
- Mark Topic as Read
- Float this Topic for Current User
- Bookmark
- Subscribe
- Mute
- Printer Friendly Page
- Mark as New
- Bookmark
- Subscribe
- Mute
- Subscribe to RSS Feed
- Permalink
- Report Inappropriate Content
dashboard for every row in the table
I have got few row of a table, and I wont associate every row with a dasboard.

In this example: dasboard show value of five row of the table.
the property Definition is equal red_economico.
How is this possible utilize 8 dashboard , each for every row ?
The value red_economico can be indexed, as if it were a array ?
red_economico(1) or red_economico(2) .....red_economico(n)
Thank you.
- « Previous Replies
-
- 1
- 2
- Next Replies »
- Mark as New
- Bookmark
- Subscribe
- Mute
- Subscribe to RSS Feed
- Permalink
- Report Inappropriate Content
Hi,
you might want to look into Trellis Setting in Properties>>Dimension>>Trellis of a Gauge chart
- Mark as New
- Bookmark
- Subscribe
- Mute
- Subscribe to RSS Feed
- Permalink
- Report Inappropriate Content
I do not understand, wath I wont, is a Table with dashboard on each row.
Kindly, might you be more comprehensible.
Thank You.
Da: Jonathan Penuliar
Inviato: lunedì 1 dicembre 2014 12:19
A: antonio bassanelli
Oggetto: Re: - dashboard for every row in the table
<http://community.qlik.com/> Qlik Community
dashboard for every row in the table
reply from Jonathan Penuliar
<http://community.qlik.com/people/JPenuliar?et=watches.email.thread> in
Education Services - View the full discussion
<http://community.qlik.com/message/669069?et=watches.email.thread#669069>
- Mark as New
- Bookmark
- Subscribe
- Mute
- Subscribe to RSS Feed
- Permalink
- Report Inappropriate Content
Hi Antonio,
If i understand you correctly, you want a dashboard similar to attached correct?
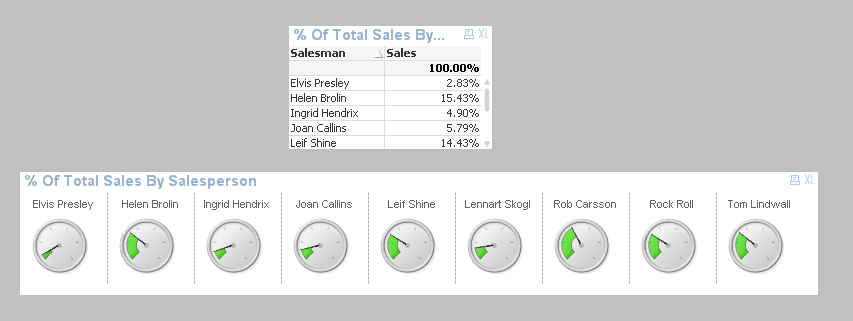
- Mark as New
- Bookmark
- Subscribe
- Mute
- Subscribe to RSS Feed
- Permalink
- Report Inappropriate Content
Hi,
i have seen your trellis gauge.png, and I have to say you that it's exact, but How do i do it ?
before there is a table and than you have created a series of dashborad, And just so ?
can i help me.
Thank you
- Mark as New
- Bookmark
- Subscribe
- Mute
- Subscribe to RSS Feed
- Permalink
- Report Inappropriate Content
Yes you are right , i have seen your attached, but Can you explain me how
did you do that ?
After have you used a table and than a series of dashboars ?
Can i help me ?
Da: Jonathan Penuliar
Inviato: lunedì 1 dicembre 2014 15:02
A: antonio bassanelli
Oggetto: Re: - Re: dashboard for every row in the
table
<http://community.qlik.com/> Qlik Community
Re: dashboard for every row in the table
reply from Jonathan Penuliar
<http://community.qlik.com/people/JPenuliar?et=watches.email.thread> in
Education Services - View the full discussion
<http://community.qlik.com/message/669332?et=watches.email.thread#669332>
- Mark as New
- Bookmark
- Subscribe
- Mute
- Subscribe to RSS Feed
- Permalink
- Report Inappropriate Content
Hi Antonio,
the two tables are exactly the same, only different object type, one is Straight table, and the other is a Gauge Chart, this is where we both get confused because you are calling it dashboard( we might have different definition of dashboard here, lol). you can start from a straight table to generate your table(data) then change the chart type to Gauge, then you can set the Trellis settings (attached pic)
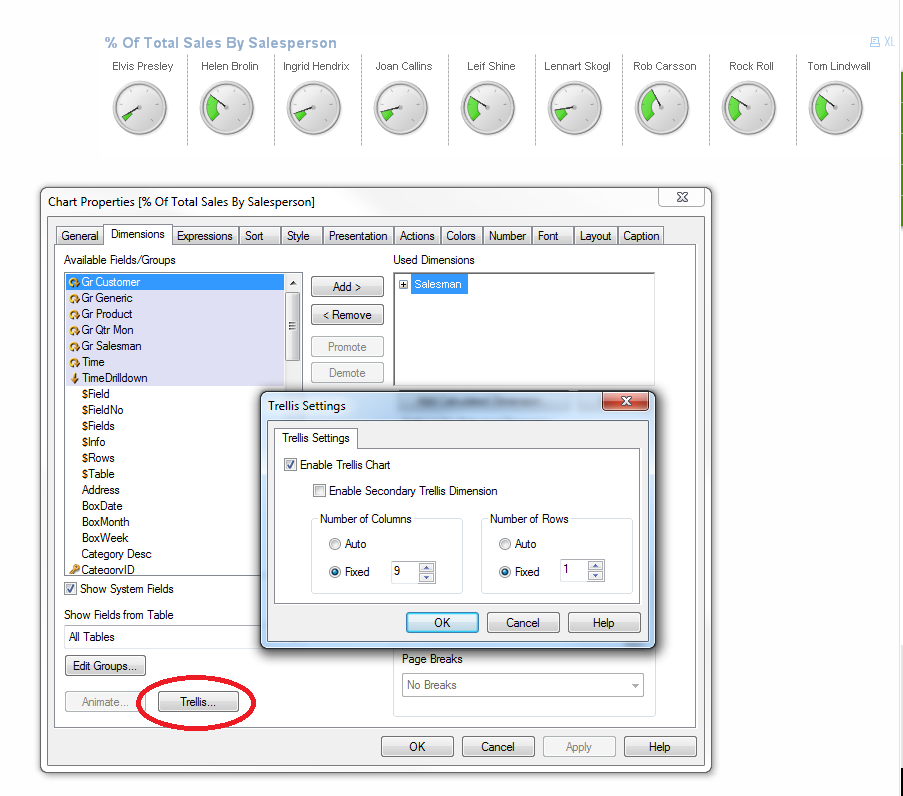
- Mark as New
- Bookmark
- Subscribe
- Mute
- Subscribe to RSS Feed
- Permalink
- Report Inappropriate Content
Thank you so much.
Yes I 'm understand , There are successful
I saw the button trellis in the chart property.
Thank you very much
Da: Jonathan Penuliar
Inviato: lunedì 1 dicembre 2014 16:27
A: antonio bassanelli
Oggetto: Re: - Re: dashboard for every row in the
table
<http://community.qlik.com/> Qlik Community
Re: dashboard for every row in the table
reply from Jonathan Penuliar
<http://community.qlik.com/people/JPenuliar?et=watches.email.thread> in
Education Services - View the full discussion
<http://community.qlik.com/message/669394?et=watches.email.thread#669394>
- Mark as New
- Bookmark
- Subscribe
- Mute
- Subscribe to RSS Feed
- Permalink
- Report Inappropriate Content
Hi,
Or is this what you are looking for? I must admit not very pretty but I think you get the general idea.
- Mark as New
- Bookmark
- Subscribe
- Mute
- Subscribe to RSS Feed
- Permalink
- Report Inappropriate Content
Hi, Nils
This is exactly what I wanted,
But the structure that you have utilized is a table ??
As you did to put a dashboard as a field in a table ?
Can you explain me ?
Thank you, Nils ?
Da: Nils Morris
Inviato: venerdì 5 dicembre 2014 22:15
A: antonio bassanelli
Oggetto: Re: - dashboard for every row in the table
<http://community.qlik.com/> Qlik Community
dashboard for every row in the table
reply from Nils Morris
<http://community.qlik.com/people/nmi?et=watches.email.thread> in Education
Services - View the full discussion
<http://community.qlik.com/message/674508?et=watches.email.thread#674508>
- « Previous Replies
-
- 1
- 2
- Next Replies »