Unlock a world of possibilities! Login now and discover the exclusive benefits awaiting you.
- Qlik Community
- :
- Discover
- :
- Programs
- :
- Education
- :
- Qlik Education Discussions
- :
- Re: Last 3 months data in expression for a bar cha...
- Subscribe to RSS Feed
- Mark Topic as New
- Mark Topic as Read
- Float this Topic for Current User
- Bookmark
- Subscribe
- Mute
- Printer Friendly Page
- Mark as New
- Bookmark
- Subscribe
- Mute
- Subscribe to RSS Feed
- Permalink
- Report Inappropriate Content
Last 3 months data in expression for a bar chart
Hi all ,
i have 12 months of data , in which i would like to use last 3 months of data while displaying in bar chart.
for suppose i have feb 2014 to jan 2015 data , my last 3 months data should be jan 2015, dec 2014, Nov 2014
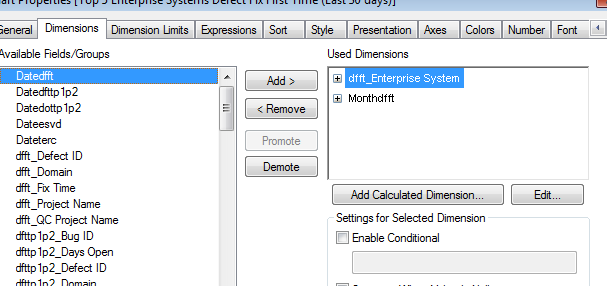
my dimensions are
terc_defect
monthterc
i need an expression to take last 3 months data
Thanks in advance
- « Previous Replies
- Next Replies »
- Mark as New
- Bookmark
- Subscribe
- Mute
- Subscribe to RSS Feed
- Permalink
- Report Inappropriate Content
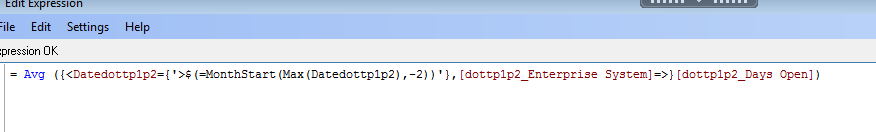
=avg({<Montterc={'>$(=monthStart(max(Montterc),-2))'} ,[Enterprise system]= >}days_open)
Script:
LOAD days_open,
[Enterprise system],
date(Montterc) as Montterc
FROM
[151270.xlsx]
(ooxml, embedded labels, table is tab1);
- Mark as New
- Bookmark
- Subscribe
- Mute
- Subscribe to RSS Feed
- Permalink
- Report Inappropriate Content
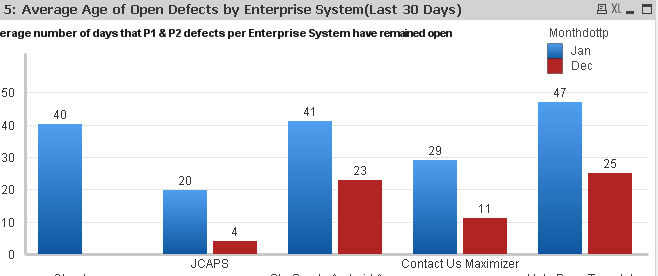
i am not getting the last 3 months , infact if you can see in the image i am getting all months .
i see my expression is sum(days_open)/count(enterprise system)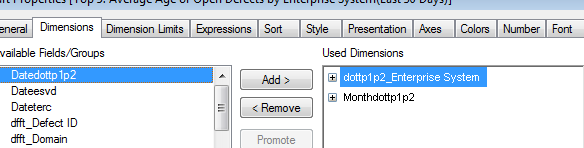

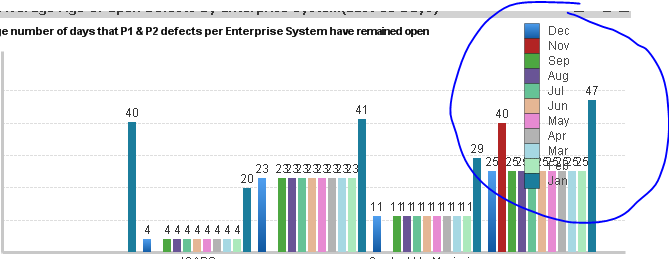

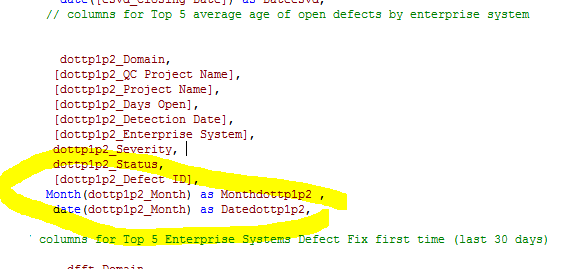
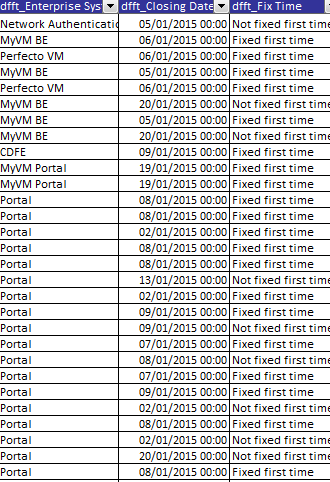
the 4th image is sample data . for jan file . the same way i have all 12 months data .
- Mark as New
- Bookmark
- Subscribe
- Mute
- Subscribe to RSS Feed
- Permalink
- Report Inappropriate Content
hey sorry it is coming . since i have to give field name date(dottp1p2_month) as datedottp1p2 in set analysis
but when i give set analysis expression , i am getting only 2 months . jan and dec months
- Mark as New
- Bookmark
- Subscribe
- Mute
- Subscribe to RSS Feed
- Permalink
- Report Inappropriate Content
In expression change 2 to 3?
Does it work now?
If yes could you mark the replay as Correct/Helpful
- Mark as New
- Bookmark
- Subscribe
- Mute
- Subscribe to RSS Feed
- Permalink
- Report Inappropriate Content
yes it is working when i change from 2 to 3 , but i wonder why.
i have another question . it is related to same data .can i ask here ?
how to add 2 conditions in set analysis ?
for suppose i am filtering records in a column , they are two values . fixed and not fixed . i am flitering not fixed count using set analysis and now i should also restrict month values in that expression?
- Mark as New
- Bookmark
- Subscribe
- Mute
- Subscribe to RSS Feed
- Permalink
- Report Inappropriate Content
i have already marked it has correct answer ,so sorting on average i could just give like 
now last question is , i am sending you screenshots
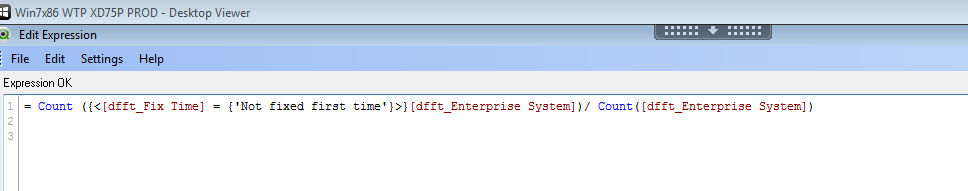
the last image i am using expression to filter "not fixed first time" , but i also need to filter last 3 months in this expression now.
thanks in advance
- Mark as New
- Bookmark
- Subscribe
- Mute
- Subscribe to RSS Feed
- Permalink
- Report Inappropriate Content
Sorry I can not help on that..
I have seen you have posted another question on that topic..
Good luck
- Mark as New
- Bookmark
- Subscribe
- Mute
- Subscribe to RSS Feed
- Permalink
- Report Inappropriate Content
no worries thanx for the help though
- « Previous Replies
- Next Replies »