Unlock a world of possibilities! Login now and discover the exclusive benefits awaiting you.
This space offers a variety of blogs, all written by Qlik employees. Product and non product related.
Product Innovation
By reading the Product Innovation blog, you will learn about what's new across all of the products in our growing Qlik product portfolio.
Support Updates
The Support Updates blog delivers important and useful Qlik Support information about end-of-product support, new service releases, and general support topics.
Qlik Academic Program
This blog was created for professors and students using Qlik within academia.
Community News
Hear it from your Community Managers! The Community News blog provides updates about the Qlik Community Platform and other news and important announcements.
Qlik Digest
The Qlik Digest is your essential monthly low-down of the need-to-know product updates, events, and resources from Qlik.
Qlik Education
The Qlik Education blog provides information about the latest updates of our courses and programs with the Qlik Education team.
Recent Blog Posts
-
Welcome Priscila Papazissis-Qlik Educator Ambassador for 2024!
In this weeks blog we meet Priscila Papazissis, a new Educator Ambassador for 2024 as well as a Qlik Luminary for the second year! -
Conditional Show/Hide Dimensions and Measures in a Chart
Conditional show or hide is available in line and bar charts giving the user the ability to toggle dimensions or measures on or off in a single chart. This allows developers to customize line and bar charts and save space by using one chart to show various metrics and dimensions. Let’s look at a simple way of using this feature to show or hide lines in a line chart. In the Overall Equipment Efficiency demo found on the Demo Site, there is a line ... Show MoreConditional show or hide is available in line and bar charts giving the user the ability to toggle dimensions or measures on or off in a single chart. This allows developers to customize line and bar charts and save space by using one chart to show various metrics and dimensions. Let’s look at a simple way of using this feature to show or hide lines in a line chart. In the Overall Equipment Efficiency demo found on the Demo Site, there is a line chart accompanied by buttons that are used to toggle the lines on and off in the line chart.
This is done by using variables. When each button is clicked, the respective variable is toggled from 0 to 1 or 1 to 0 depending on its current value. See the value expression in the image below.
In the measure expression in the line chart, this variable is checked to determine if the expression should be evaluated and displayed or if the measure should be set to null.
This is a perfectly good way to toggle the lines, but with the ability to use conditional show and hide in line and bar charts, this process can be simplified. First, in the measure expression, we no longer need to use an if statement which can help reduce calculation time. We can simply use our normal expression and the “Show measure if” setting, with the respective variable, to evaluate if a line should be shown in the visualization or not.
The “Show measure if” and “Show dimension if” settings evaluate the expression and will show the line if the expression evaluates to true. In my example, vShowOEE will be either 1 or 0. If it is 1, the line will be displayed. If it is 0, then it will not be displayed. We can continue to use the buttons to toggle the respective variable (from 1 to 0 and vice versa) for each line.
My example is basic, but more complex expressions can be used as well. For example, you may want to show/hide lines based on a selection or a calculated value or you may want to use some business logic to determine which dimension or measure should be displayed. The expression can be as simple or complex as needed, as long as it returns a true or false value. Keep in mind, that this show setting is optional and can be left blank. When no expression is entered, the line (or bar) is displayed.
There are a few limitations of this new feature to be aware of: 1) Custom tooltips are disabled when using a conditional dimension, 2) Time series forecasting is not available when using conditional dimensions or measures. While the “Show measure if” and the “Show dimension if” can both be used in the same chart, it is recommended that you use only one at a time. Check out Qlik Help to learn more and test this new feature out in your next line or bar chart.
Thanks,
Jennell
-
Making a Multilingual Qlik Sense App
A colleague of mine had translated two demos from the Demo Site to Japanese and wanted to know if we could post them on the Demo Site alongside the English versions. We decided that it would be best to combine the English and Japanese versions into one multilingual Qlik Sense app making it easier for us to add additional languages to the app as needed. It was an easy process and required only a few steps:Create a translation sheet with all the la... Show MoreA colleague of mine had translated two demos from the Demo Site to Japanese and wanted to know if we could post them on the Demo Site alongside the English versions. We decided that it would be best to combine the English and Japanese versions into one multilingual Qlik Sense app making it easier for us to add additional languages to the app as needed. It was an easy process and required only a few steps:
- Create a translation sheet with all the languages that will be available in the app
- Update the script to add a table of the translations and a list of the languages available in the app
- Add a Language filter pane to every sheet in the app that allows only one selected value
- Update sheet names, chart titles, subtitles and labels with an expression that will display the text in the selected language
Create Translation Sheet
To begin the process of making a demo multilingual, I created an Excel file with all the languages that are to be included in the app. Below is a snippet of the worksheet. The first column, Index, has a unique value which will be used in the charts and expressions to indicate what data should be displayed. The second and third columns are the languages to be used in the app. An additional column can be added for additional languages that need to be added to the app. In this scenario, I entered all the English text (sheet names, chart titles and subtitles, labels and text) and then using the Japanese version of the app, I entered the respective Japanese text. If I did not have the Japanese version of the app, I would have shared the Excel file with someone who could enter the Japanese translations for me. Preparing the Excel file in this format makes it easy to add additional languages to the app without having to update the QVF.
Snippet of Excel translation sheet
Update the Script
Once the translation sheet was created, it needed to be loaded into the data model. The script below is what I added to the demo.
On line 1, the HidePrefix system variable is used to hide all fields that begin with “#.” Starting on line 3, the Excel file is loaded. Once it is loaded, the vLanguage variable is set to the expression “=Minstring(#LANGUAGE).” This is an important step and we will take a closer look at this when we update the front-end. On line 13, the languages from the Excel file are loaded - users can select the language they would like to view from this list. These languages are then stored in the #LANGUAGE field which will be hidden from the user (since it starts with “#”).
Add Language Filter
One each sheet in the app, I added a Language filter pane using the dimension #LANGUAGE that was created in the script. Once the script is reloaded with the HidePrefix variable, the #LANGUAGE field will not be visible, but you can still use it as the dimension in the Language filter pane. I needed to see the field temporarily so I commented out the HidePrefix line in the script and reloaded so I could change a setting on the field. I only want the user to be able to select one Language at a time, so I needed to check the “Always one selected value” checkbox in the Field settings of the #LANGUAGE field. (Right click on the #LANGUAGE field and select Field settings to see the window below).
Field settings dialog window
Once my settings are saved, I uncommented the HidePrefix line and reloaded the app to hide the #LANGUAGE field again. The filter pane will look like this (image below) and only one language can be selected at any given time. When a language is selected, the vLanguage variable (that was created in the script) will store the language. This variable is used later when updating the text in the UI.
Language filter pane
Update Front-End
Now the last step is to update everything in the app that should be translated. In this scenario, I updated sheet names, chart titles and subtitles, chart labels, KPI text and text on the sheets. Here is an example of how I updated the title of the Language filter pane. In the title field, I entered:
In the snippet below from the Excel translation sheet, the Index is 64 for the text “Language” which is why I used it in the expression above for the title of the Language filter pane. This expression will return either the English or Japanese translation for Language depending on the value of the variable vLanguage.
Snippet from Excel translation sheet
Another piece of information I would like to share is how I handled Text & image objects that needed to be translated. In the screenshot below, there is heading text and body text that have 2 different formats (font size and font color).
To handle this, I created two variables, one for the heading and one for the body and in the variables, I stored the translation expression.
This way, I was able to not only translate the text but format the text in a single Text & image chart two different ways.
As you can see, it is easy to make a Qlik Sense app multilingual and it is easy to update the app with additional languages as needed. Sales, Customer Experience & Churn and Supply Chain – Inventory & Product Availability are the two demos that were made multilingual. Check them out and switch between the languages to see the final results. If you are interested in doing this in QlikView, check out Chuck Bannon’s blog on this topic as well as making the data multilingual in a QlikView app.
Thanks,
Jennell
-
Techspert Talks - Understanding Set Analysis
Hi everyone, Want to stay a step ahead of important Qlik support issues? Then sign up for our monthly webinar series where you can get first-hand insights from Qlik experts. The Techspert Talks session from March looked at Understanding Set Analysis. But wait, what is it exactly?Techspert Talks is a free webinar held on a monthly basis, where you can hear directly from Qlik Techsperts on topics that are relevant to Customers and Partners today. T... Show MoreHi everyone,
Want to stay a step ahead of important Qlik support issues? Then sign up for our monthly webinar series where you can get first-hand insights from Qlik experts.The Techspert Talks session from March looked at Understanding Set Analysis.
But wait, what is it exactly?
Techspert Talks is a free webinar held on a monthly basis, where you can hear directly from Qlik Techsperts on topics that are relevant to Customers and Partners today.This session covers:
- How Set Analysis works
- Possible and Excluded selections
- Using Advanced Expressions
Click on this link to see the presentation.
-
Introducing the New Layout Container - Tips, Tricks, Nuances
This week I’m kicking off the holiday season with a gift that gives you new ways to create content and design dashboards in Qlik Analytics, our new layout container object. -
Let's Take a walk on the Calendar / Date Bridge: Working with Multiple Dates / ...
This topic has been covered before, but we have a new generation of Qlik users and I found some of the content not always easily explained. Here is my spin to help you get started working with multiple dates / calendars. Sample App and data attached! -
-
WhatsApp Automation Integration for Qlik Application Automation
WhatsApp Automation Integration for Qlik Application AutomationDataGlow ITWhatsApp is missing as a native delivery target from Qlik Application Automation. DataGlow IT have engineered a process to allow output WhatsApp as an alternative to delivery via Teams, Slack or Email. Utilising WhatsApp as a delivery target opens up multiple use cases for Customer and Consumer data delivery. Furthermore, there also exists the ability to have a configura... Show MoreWhatsApp Automation Integration for Qlik Application AutomationDataGlow ITWhatsApp is missing as a native delivery target from Qlik Application Automation. DataGlow IT have engineered a process to allow output WhatsApp as an alternative to delivery via Teams, Slack or Email. Utilising WhatsApp as a delivery target opens up multiple use cases for Customer and Consumer data delivery. Furthermore, there also exists the ability to have a configurable conversation via WhatsApp, optionally utilising further 2 way interactions with Qlik Application Automation.
Discoveries
Share data from Qlik outside of the standard business delivery systems such as Teams, Slack and Email. Have conversations with your

Impact
Governed conversations, data and updates can now be shared to both Customers and Colleagues via WhatsApp, enabling them delivery and key data points from Qlik without needing Qlik licensing, or corporate comms infrastructure such as Teams or SharePoint.

Audience
Ideal for rolling out updates for Customers to WhatsApp directly from Qlik. Examples include delivering order status updates, surveys and regular KPI delivery.

Data and advanced analytics
Gather ultra-responsive feedback from clients and colleagues via a native and frequently used platform in WhatsApp.
-
Troubleshooting your Qlik Sense Installation or Upgrade
Hi everyone! This is now my second blog post! yeahhh!!!! And today I wanted to talk about a topic that is generating a lot of discussions in the Qlik Sense Deployment & Management space: Upgrades and Installations. -
Sunburst Chart Demo
Sunburst Chart Demo AnyChart Sunburst charts are greatly useful for visualizing hierarchical data. Explore their major features in this demonstration app powered by AnyChart's Sunburst Chart extension for Qlik Sense. Discoveries Discover how sunburst charts can help you. Explore multiple ways of displaying hierarchies and measures, drill-down, flexible labels, custom colors, center content, HTML tooltips, and more. Impact Experie... Show MoreSunburst Chart DemoAnyChartSunburst charts are greatly useful for visualizing hierarchical data. Explore their major features in this demonstration app powered by AnyChart's Sunburst Chart extension for Qlik Sense.
Discoveries
Discover how sunburst charts can help you. Explore multiple ways of displaying hierarchies and measures, drill-down, flexible labels, custom colors, center content, HTML tooltips, and more.

Impact
Experience firsthand how an interactive sunburst chart can empower intuitive exploration of hierarchical data structures through a set of sliced concentric rings and how it can be tailored to specific needs.

Audience
Everyone looking to enable more efficient and insightful exploration of hierarchical datasets within their Qlik environment.

Data and advanced analytics
This app features sunburst visualizations powered by AnyChart's Sunburst Chart extension for Qlik Sense, using U.S. Census data for illustration.
-
Welcome back Blerim Emruli-Qlik Educator Ambassador for 2024!
This is Blerim's fourth year as a Qlik Academic Program Educator Ambassador! -
Copy & Paste Style
There have been new Qlik Sense features the past few months that I was excited to see. One of my favorites, which I am sure you are aware of, is the layout container. If you have not heard about it, check out Michael’s blog post here. Another favorite of mine is the copy and paste style feature which allows developers to copy and paste styles from one visualization to another. With all the styling options available in visualizations, being able t... Show MoreThere have been new Qlik Sense features the past few months that I was excited to see. One of my favorites, which I am sure you are aware of, is the layout container. If you have not heard about it, check out Michael’s blog post here. Another favorite of mine is the copy and paste style feature which allows developers to copy and paste styles from one visualization to another. With all the styling options available in visualizations, being able to copy and paste styles saves time and eliminates the need to go into the styling properties of each visualization and set all the styling options you would like to use.
Some of the latest charts that have been upgraded to the new styling property panel are the Grid, Funnel and Sankey, giving users the ability to customize the title, subtitle, footnote, and background of a chart as well as the style the axes, labels, legends, and values in a visualization. Borders and shadows can be added to these visualizations as well.
The Filter Pane now has font styling for the title, subtitle, footnote, and header as well as font header and content styling. Like the charts above, borders and shadows can be added as well. Developers can change the background color or use an image in the background and control the color of the selected state. Here are a few examples.
With all these styling options, it is awesome that developers can now copy and paste the style from one visualization to another. If you remember the QlikView days, you know how valuable this feature is. Assume I have an app with a theme applied and have made some styling changes to the Margin KPI (see image below). If I want to apply the same styling changes to the Margin %, I have two options. One option is to open the styling properties of the Margin % KPI and make the same changes to the background color, border color and shadowing.
The second option and the easiest option is to right click on the Margin KPI while in Edit mode, click on the three dots (…) and select Copy style.
Then right click on the Margin % KPI, click on the three dots (…) and select Paste style.
That is a lot easier than styling the KPI manually, especially if there are multiple visualizations to update.
There are a few limitations to using the copy and paste style - you cannot copy and paste the style in a map or a master visualization. New styling properties for visualizations are being add all the time, giving users many options to style and make their app stand out. The copy and paste functionality is a great addition to Qlik Sense and makes designing and styling apps easier.
Thanks,
Jennell
-
-
Canonical Date
A common situation when loading data into a Qlik document is that the data model contains several dates. For instance, in order data you often have one order date, one required date and one shipped date. This means that one single order can have multiple dates; in my example one OrderDate, one RequiredDate and several ShippedDates - if the order is split into several shipments: So, how would you link a master calendar to this? Well,... Show MoreA common situation when loading data into a Qlik document is that the data model contains several dates. For instance, in order data you often have one order date, one required date and one shipped date.
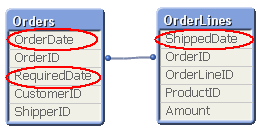
This means that one single order can have multiple dates; in my example one OrderDate, one RequiredDate and several ShippedDates - if the order is split into several shipments:

So, how would you link a master calendar to this?
Well, the question is incorrectly posed. You should not use one single master calendar for this. You should use several. You should create three master calendars.
The reason is that the different dates are indeed different attributes, and you don’t want to treat them as the same date. By creating several master calendars, you will enable your users to make advanced selections like “orders placed in April but delivered in June”. See more on Why You sometimes should Load a Master Table several times.
Your data model will then look like this:
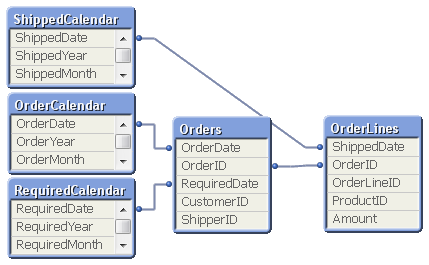
But several different master calendars will not solve all problems. You can for instance not plot ordered amount and shipped amount in the same graph using a common time axis. For this you need a date that can represent all three dates – you need a Canonical Date. This is how you create it:
First you must find a table with a grain fine enough; a table where each record only has one value of each date type associated. In my example this would be the OrderLines table, since a specific order line uniquely defines all three dates. Compare this with the Orders table, where a specific order uniquely defines OrderDate and RequiredDate, but still can have several values in ShippedDate. The Orders table does not have a grain fine enough.
This table should link to a new table – a Date bridge – that lists all possible dates for each key value, i.e. a specific OrderLineID has three different canonical dates associated with it. Finally, you create a master calendar for the canonical date field.
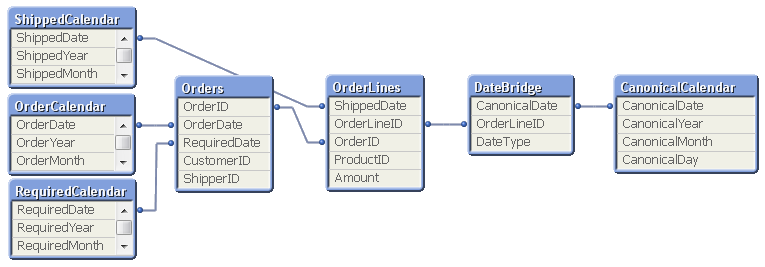
You may need to use ApplyMap() to create this table, e.g. using the following script:
DateBridge:
Load
OrderLineID,
Applymap('OrderID2OrderDate',OrderID,Null()) as CanonicalDate,
'Order' as DateType
Resident OrderLines;Load
OrderLineID,
Applymap('OrderID2RequiredDate',OrderID,Null()) as CanonicalDate,
'Required' as DateType
Resident OrderLines;Load
OrderLineID,
ShippedDate as CanonicalDate,
'Shipped' as DateType
Resident OrderLines;If you now want to make a chart comparing ordered and shipped amounts, all you need to do is to create it using a canonical calendar field as dimension, and two expressions that contain Set Analysis expressions:
Sum( {$<DateType={'Order'}>} Amount )
Sum( {$<DateType={'Shipped'}>} Amount )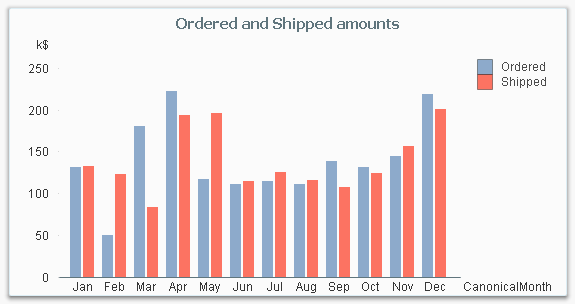
The canonical calendar fields are excellent to use as dimensions in charts, but are somewhat confusing when used for selections. For this, the fields from the standard calendars are often better.
Summary:
- Create a master calendar for each date. Use these for list boxes and selections.
- Create a canonical date with a canonical calendar. Use these fields as dimension in charts.
- Use the DateType field in a Set Expression in the charts.
A good alternative description of the same problem can be found here. Thank you, Rob, for inspiration and good discussions.
-
Qlik Replicate and Google Big Query Issue Identified
Hello Qlik Users!An issue has been identified for Qlik Replicate users when using Google Big Query as the Target Endpoint. The load may fail if the dataset is outside the US and the region is not set for the INFORMATION_SCHEMA.The current workaround is as follows:Open the Big Query endpoint definitionClick on the Advanced tab Internal ParametersIn the search box for the parameter name type (case sensitive): $info.query_syntax.check_schema_exist ... Show MoreHello Qlik Users!
An issue has been identified for Qlik Replicate users when using Google Big Query as the Target Endpoint. The load may fail if the dataset is outside the US and the region is not set for the INFORMATION_SCHEMA.
The current workaround is as follows:
- Open the Big Query endpoint definition
- Click on the Advanced tab Internal Parameters
- In the search box for the parameter name type (case sensitive):
$info.query_syntax.check_schema_exist For its vale enter - select count(*) from region-eu.INFORMATION_SCHEMA.SCHEMATA where SCHEMA_NAME = '${TABLE_OWNER}'4. Save and restart the task.
Note: The above script will force Qlik Replicate to query with the syntax of ‘region-eu’. Please use the relevant region value.
For more information, please see Unqualified INFORMATION_SCHEMA queries views will default to returning metadata from outside the US.
If you have any questions, please let us know in the comments below. If you found this information useful, give the post a ‘like’! Make sure you’re subscribed to the Qlik Support Updates Blog to get the latest information from Qlik Support.
Thank you for choosing Qlik!
Kind regards,
Qlik Global Support
-
Qlik and Talend Subprocessors General Data Protection Regulation (GDPR) - Versio...
Table of Contents Third party subprocessors for Qlik offeringsThird party subprocessors for Talend offeringsAffiliate Subprocessors for Qlik and Talend Version 5.1. Current as of: 29th February 2024 Qlik and Talend, a Qlik company, may from time to time use the following Qlik and Talend group companies and/or third parties (collectively, “Subprocessors”) to process personal data on customers’ behalf (“Customer Personal Data”) for purposes of pr... Show MoreTable of Contents
- Third party subprocessors for Qlik offerings
- Third party subprocessors for Talend offerings
- Affiliate Subprocessors for Qlik and Talend
Version 5.1. Current as of: 29th February 2024
Qlik and Talend, a Qlik company, may from time to time use the following Qlik and Talend group companies and/or third parties (collectively, “Subprocessors”) to process personal data on customers’ behalf (“Customer Personal Data”) for purposes of providing Qlik and/or Talend Cloud, Support Services and/or Consulting Services.
Qlik and Talend have relevant data transfer agreements in place with the Subprocessors (including group companies) to enable the lawful and secure transfer of Customer Personal Data.
You can receive updates to this Subprocessor list by subscribing to this blog or by enabling RSS feed notifications.
Third party subprocessors for Qlik offerings
Third party subprocessors for Qlik Cloud
Third Party
Location of processing
Service Provided
Amazon Web Services (AWS)
If EU region is chosen:
- Ireland (Republic of); &
Paris, France (back-up); or
- Frankfurt, Germany; &
Milan, Italy (back-up); or
- London, UK; &
Spain (back-up).
- Frankfurt, Germany (Blendr only).
If US region is chosen:
- North Virginia, US; &
Ohio, US (back-up).
Customer may select one of three APAC locations:
- Sydney, Australia; &
Melbourne, Australia (back-up); or
- Singapore; &
Seoul, South Korea (back-up ); or
- Tokyo, Japan;
Osaka, Japan (back-up).
Qlik Cloud is hosted through AWS
MongoDB
If EU region is chosen:
- Ireland (Republic of);&
Paris, France (back-up); or
- Frankfurt, Germany; &
Milan, Italy (back-up); or
- London, UK; &
Spain (back-up)
- Frankfurt, Germany (Blendr only).
If US region is chosen:
- North Virginia, US; &
Ohio, US (back-up).
Customer may select one of two APAC locations:
- Sydney, Australia; &
Melbourne, Australia (back-up); or
- Singapore; &
Seoul, South Korea (back-up).
Any data inputted into the Notes feature in Qlik Cloud
Third party subprocessors for Qlik Support Services and/or Consulting Services
The vast majority of Qlik’s support data that it processes on behalf of customers is stored in Germany (AWS). However, in order to resolve and facilitate the support case, such support data may also temporarily reside on the other systems/tools below.
Amazon Web Services (AWS)
Germany
Support case management tools
Salesforce
UK
Support case management tools
Grazitti SearchUnify
United States
Support case management tools
Microsoft
United States
Customer may send data through Office 365
Ada
Germany
Support Chatbot
Persistent
India
R&D Support Services
Jira Cloud Germany, Ireland (Back-up)
R&D support management tool
Altoros
United States
R&D Support Services
Ingima
Israel
R&D Support Services
Galil
Israel
R&D Support Services
Third party subprocessors for Qlik mobile device apps
Google Firebase
United States
Push notifications
Third party subprocessors for Talend offerings
Third party subprocessors for Talend Cloud
Third Party
Location of processing
Service Provided
Amazon Web Services (AWS)
Talend Cloud
AMERICAS:
- Virginia, US; &
Oregon, US (backup).
EMEA:
- Frankfurt, Germany; &
Ireland (Republic of)(backup).
APAC:
- Tokyo, Japan; & Singapore (backup); or
- Sydney, Australia; & Singapore (backup).
Stitch
AMERICAS:
- Virginia, US; &
Oregon, US (backup).
EMEA:
- Frankfurt, Germany; &
Ireland (Republic of) (backup).
These Talend Cloud locations are hosted through AWS
Microsoft Azure
United States:
California; Virginia (backup)
These Talend Cloud locations are hosted through Microsoft Azure
MongoDB
See Talend Cloud locations above
Third party subprocessors for Talend Support Services and/or Consulting Services:
In order to provide Support and/or Consulting Services, the following third party tools may be used.
Sub-processor
Data Center Location
Service Provided
Github
United States
Support ticket replication, troubleshooting
Intercom
United States
In-app customer support messaging service
Atlassian
France
United States
Project management; support issue tracking
Jira Cloud Germany, Ireland (Back-up)
R&D support management tool
Microsoft
United States
Email provider, if the Customer sends Customer Personal Data through email.
Proofpoint Secure Share
United States
File sharing if Customer files include Customer Personal Data.
Salesforce
United States
CRM; support case management
Affiliate Subprocessors for Qlik and Talend
Affiliate Subprocessors
These affiliates may provide services, such as Consulting or Support, depending on your location and agreement(s) with us. Our Support Services are predominantly performed in the customer’s region: EMEA – France, Sweden, Spain, Israel; Americas – USA; APAC – Japan, Australia, India.
Subsidiary Affiliate
Location
QlikTech International AB, Talend Sweden AB
Sweden
QlikTech Nordic AB
Sweden
QlikTech Latam AB
Sweden
QlikTech Denmark ApS
Denmark
QlikTech Finland OY
Finland
QlikTech France SARL, Talend SAS
France
QlikTech Iberica SL (Spain), Talend Spain, S.L.
Spain
QlikTech Iberica SL (Portugal liaison office), Talend Sucursal Em Portugal
Portugal
QlikTech GmbH, Talend Germany GmbH
Germany
QlikTech GmbH (Austria branch)
Austria
QlikTech GmbH (Swiss branch), Talend GmbH
Switzerland
QlikTech Italy S.r.l., Talend Italy S.r.l.
Italy
Talend Limited
Ireland
QlikTech Netherlands BV, Talend Netherlands B.V.
Netherlands
QlikTech Netherlands BV (Belgian branch)
Belgium
Blendr NV
Belgium
QlikTech UK Limited, Talend Ltd.
United Kingdom
Qlik Analytics (ISR) Ltd.
Israel
QlikTech International Markets AB (DMCC Branch)
United Arab Emirates
QlikTech Inc., Talend, Inc., Talend USA, Inc.
United States
QlikTech Corporation (Canada), Talend (Canada) Limited
Canada
QlikTech México S. de R.L. de C.V.
Mexico
QlikTech Brasil Comercialização de Software Ltda.
Brazil
QlikTech Japan K.K., Talend KK
Japan
QlikTech Singapore Pte. Ltd., Talend Singapore Pte. Ltd.
Singapore
QlikTech Hong Kong Limited
Hong Kong
Qlik Technology (Beijing) Limited Liability Company, Talend China Beijing Technology Co. Ltd.
China
QlikTech India Private Limited, Talend Data Integration Services Private Limited
India
QlikTech Australia Pty Ltd, Talend Australia Pty Ltd.
Australia
QlikTech New Zealand Limited
New Zealand
In addition to the above, other professional service providers may be engaged to provide you with professional services related to the implementation of your particular Qlik and/or Talend offerings; please contact your Qlik account manager or refer to your SOW on whether these apply to your engagement.
Qlik and Talend reserve the right to amend its products and services from time to time. For more information, please see www.qlik.com/us/trust/privacy and/or https://www.talend.com/privacy/.
-
Special Event: Free Academic Program Webinar for Poland
Are you an Educator in Poland keen to learn about how you can get access to free Qlik software and learning resources? Join this exclusive webinar hosted by our Educator Ambassadors! -
Fiscal Year
A common situation in Business Intelligence is that an organization uses a financial year (fiscal year) different from the calendar year. Which fiscal year to use, varies between businesses and countries. [Wikipedia] But how would you solve that in QlikView? -
Bed Invetory
Bed InvetoryGain Insights solution pvt ltdIts show the figure of bed inventory and how health care domain will workDiscoveriesWe deep drive into health domain and how the will do bed inventoryImpactIt impacts the how we done the business by the end and how we are doing our businessAudiencecount of beds Data and advanced analyticsGraphs of visualization -
Qlik Digest - February 2024
The buzz around AI continues to build. However, amongst all the noise is a definite feeling of information overload. So, it’s understandable that many data and analytics leaders remain uncertain of the technology’s real benefits and their road to adoption.


