Unlock a world of possibilities! Login now and discover the exclusive benefits awaiting you.

Analytics & AI
Forums for Qlik Analytic solutions. Ask questions, join discussions, find solutions, and access documentation and resources.
Data Integration & Quality
Forums for Qlik Data Integration solutions. Ask questions, join discussions, find solutions, and access documentation and resources
Explore Qlik Gallery
Qlik Gallery is meant to encourage Qlikkies everywhere to share their progress – from a first Qlik app – to a favorite Qlik app – and everything in-between.
Qlik Community
Get started on Qlik Community, find How-To documents, and join general non-product related discussions.
Qlik Resources
Direct links to other resources within the Qlik ecosystem. We suggest you bookmark this page.
Qlik Academic Program
Qlik gives qualified university students, educators, and researchers free Qlik software and resources to prepare students for the data-driven workplace.
Recent Blog Posts
-
Changes to the Qlik Cloud Data Alerts history retention starting April 20th, 202...
Today, the Data Alerts feature in Qlik Cloud Analytics retains a history of data that meets the alert condition indefinitely. An upcoming change will ... Show MoreToday, the Data Alerts feature in Qlik Cloud Analytics retains a history of data that meets the alert condition indefinitely. An upcoming change will introduce an automated purge.
For more information on Data Alerts, see Monitoring data with alerts.
What will the new retention policy be?
The retention records (seen in Data Alert history) of Data Alert executions will be purged after 90 days or after 10 records (if not within the 90-day window).
Why is the retention policy changing?
The Data Alert feature was not designed to support long-term retention of data sets outside the core Qlik Sense App, but to allow you to detect outliers and anomalies in your data using quick and timely alerts.
In addition, this will align the Data Alerts history with other retention periods on the platform and help eliminate ambiguity.
What do I need to do?
Unless data alert history is required beyond the set period, no action is needed from your end.
In a use case where you need additional history, use the public APIs to facilitate the availability of alert evaluations and associated data. The Data Alerts REST API can be used to perform any required backup and retention.
For more information, see Data Alerts REST | qlik.dev.
Key end points:
- List data alert tasks
- Get data alert task
- List data alert task executions
- Get data alert task execution evaluation
When will the changes take effect?The change will be applied starting Monday, April 20th, 2026. During this week:
- The retention rules will be implemented
- History beyond the 90-day window will be purged while leaving the most recent executions untouched; this will allow reports relying on comparisons against the last evaluation to continue to work (see Comparing with the last evaluation of the alert).
- The purge will happen on a rolling basis.
If you have any questions, we're happy to assist. Reply to this blog post or take your queries to our Support Chat.
Thank you for choosing Qlik,
Qlik Support -
Qlik Talend: What to do if you receive a 'We couldn't load the application' erro...
Hello Qlik Talend admins! We introduced a new Content Delivery Network (CDN) URL to support the Talend Management Console UI. This change was previo... Show MoreHello Qlik Talend admins!
We introduced a new Content Delivery Network (CDN) URL to support the Talend Management Console UI. This change was previously communicated in the product and can be found as an item in our release notes from R2026-01.
Should you encounter the error We couldn't load the application when accessing your Talend Management Console, check with your network team to verify that the new CDN was added to any firewall exceptions.
- The change required: Allow https://cdn.cloud.talend.com
- Traffic Type: Client-side only
- The URL is fetched by the user's web browser.
- No changes are required for backend connectivity (Remote Engines and Clusters).
For all the required allowlist URLs, see Adding URLs to your proxy and firewall allowlist.
A relevant support article is available at Qlik Talend Management Console Error loading: We couldn't load the application.
If you have questions about this change, contact your CSM (Customer Success Manager) or the Support team.
Thank you for choosing Qlik,
Qlik Support -
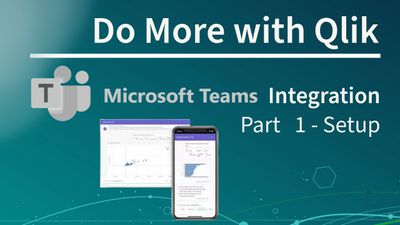
Conversational Analytics with Microsoft Teams Integration - Initial Setup - Part...
With the new Qlik Microsoft Teams app, you can easily chat with Insight Advisor, Qlik's intelligent AI assistant, to explore data using natural langua... Show MoreWith the new Qlik Microsoft Teams app, you can easily chat with Insight Advisor, Qlik's intelligent AI assistant, to explore data using natural language directly within MS Teams. Users can now ask questions through individual or group chat and Qlik will respond with AI-generated insights, using data from across your Qlik apps. And because it's Microsoft Teams, you can collaborate with others in real-time, collectively making decisions using the insights generated by Qlik. Insight Advisor within Teams provides a powerful new way to help more people find the right answers, make better decisions and collaborate together where and how they work. Check out part 1 of the 2 part series to see how to get started.
Can't see the video? YouTube blocked by your organization or region? Check it out here on the Qlik site.

-
Operationalizing Data Trust with Data Stewardship
Data now moves across teams, platforms, and AI-driven processes at a pace and scale that makes traditional passive governance insufficient. Ensuring d... Show MoreData now moves across teams, platforms, and AI-driven processes at a pace and scale that makes traditional passive governance insufficient. Ensuring data trust requires active validation by domain experts, structured accountability, and outcome-aligned remediation. We are announcing general availability of Data Stewardship in Qlik Talend Cloud (Premium and Enterprise) — a new capability designed to operationalize data trust.
So, why does data stewardship matter
Because in AI-driven environments – lack of data trust can quickly elevate the risks.
Take for example, a healthcare network uses AI to prioritize outreach to high-risk patients. The system flags thousands of records with missing allergy information, but it cannot act on what it means for the business. Are the allergies missing, or stored in another system? Is it safe to move forward with outreach, or should it pause until more information is gathered?A data steward reviews the situation, confirms the business impact, assigns ownership, and decides whether the data is safe to use. That human judgment keeps the AI workflow both responsible and reliable.
Data Stewardship in Qlik Talend Cloud accelerates governance initiatives, moving from passive to active and collaborative workflows — aligning business, data, and AI teams around a shared, trusted view of data.
Why you should use data stewardship in Qlik
Accelerate resolution with sprint-based workflows
Traditional governance processes are often ad hoc and reactive. Issues are discovered late, ownership is unclear, and remediation cycles stretch across weeks or months.
Data Stewardship introduces sprint-based workflows that replace fragmented processes with structured execution that is assigned, prioritized, tracked.
Clear ownership and SLAs bring accountability across domains. Instead of firefighting, teams move toward proactive stewardship — reducing remediation cycle times and improving transparency.
Standardize Trust with Pervasive Data Quality
Trust should not depend on isolated pure rule-based checks or tribal knowledge. Data stewardship makes data quality into a continuous, accountable practice. Instead of treating quality as a one-time check, embedded quality controls and observability signals continuously monitor, measure, and surface issues across the data lifecycle — driving proactive improvement rather than reactive fixes.
Bring domain experts into the trust loop
Automated systems are powerful — but they cannot infer business meaning on their own.
Data Stewardship brings business and data stewards directly into validation and remediation processes. Domain experts collaborate to validate flagged issues, assess business impact, apply domain-context specific remediation, and confirm resolution.
This human-in-the-loop model ensures that decisions reflect real-world business semantics — not just technical correctness. The result is higher reliability, stronger alignment, and more relevant data for downstream consumption including AI and agentic use-cases.
Run stewardship operations where data resides
Moving data across tools just to manage governance adds complexity and risk.
Data Stewardship operates directly where the data lives. By running stewardship workflows in place, organizations can avoid unnecessary data movement leveraging their existing data infrastructure (such as Snowflake), minimize operational overhead, and reduce security and compliance exposure.
Conclusion
Data quality and governance is a team effort, and data stewardship acts as the connective layer linking business users, data engineers, and AI teams. It creates clearer alignment, accelerates decision making, and strengthens organizational confidence — especially as business users drive data-powered initiatives and adopt AI. To learn more and get started, check out our documentation.
If you’d like to see Data Stewardship (and how it works with agents) in action or discuss practical data quality and governance use cases, join us at Qlik Connect 2026, taking place April 13–15, 2026 at the Gaylord Palms Resort & Convention Center in Kissimmee, Florida. This global customer event will bring together practitioners, product teams, and peers to explore real-world uses of data, analytics, and emerging capabilities.
-
Introducing Data Products for Analytics, now available!
Analytics only deliver value when insight is trusted. And trust comes from understanding the data behind it; where it came from, how it’s defined, and... Show MoreAnalytics only deliver value when insight is trusted. And trust comes from understanding the data behind it; where it came from, how it’s defined, and whether it’s fit for use.
Bringing trusted, AI-ready data products directly into Qlik Cloud Analytics
Data Products for Analytics are now available in Qlik Cloud Analytics Premium and Enterprise and Qlik Sense Enterprise.
With this release, you can turn your existing QVDs and datasets into governed, discoverable, and reusable data products, adding data quality, context, and ownership directly within your analytics environment.
What this brings:
- Stronger foundation for analytics and AI
- Turn trusted data into trusted insight
- Find and reuse trusted data, faster
Read more in our Innovation blog: Data Products for Analytics Now Available
And once you're ready to get started, here's what you'll need:
- What’s New in Qlik Cloud | Qlik Help
- Working with data products | Qlik Help
- Maximizing Data Value in the Age of AI | White Paper
- From Digital Swamp to Strategic Asset: Taming QVD Chaos with a Data Product Mindset | Blog
Thank you for choosing Qlik,
Qlik Support -
【新着レポート】Qlik、拡張データ品質ソリューションで 7 回目となるリーダーの 1 社に!
現在の AI 時代において、データ品質が重要なのはもちろん、必要不可欠でもあります。 AI 時代において、信頼性の高い AI 主導のインサイトの生成、信頼できる高品質のデータを使用したエージェンティック AI の強化が重視されています。こうしたニーズに低品質のデータを使用すると、AI 戦略の最初の... Show More現在の AI 時代において、データ品質が重要なのはもちろん、必要不可欠でもあります。 AI 時代において、信頼性の高い AI 主導のインサイトの生成、信頼できる高品質のデータを使用したエージェンティック AI の強化が重視されています。こうしたニーズに低品質のデータを使用すると、AI 戦略の最初の段階で失敗する可能性があります。
Gartner 社は、「2026年 Gartner® 拡張データ品質ソリューション Magic Quadrant」を発表しました。Gartner 社が評価した 13 社のデータ品質ベンダーの中で、Qlik は今回で 7 回目となるリーダーの 1 社に評価されました。
自社のビジネスニーズに最適なデータ品質ソリューションを選択するには?ぜひ、本レポートをご参考ください。
- Gartner 社によるデータ品質ソリューション市場に関するインサイト
- Qlik がリーダーの 1 社に評価された理由
- データ品質ソリューション市場における各メーカーの評価
- Gartner 社によるデータ品質ソリューション市場に関するインサイト
-
データ品質こそが エージェンティック AI のガードレールとなる(Qlik Blog 翻訳)
本ブログは "Data Quality Is the Guardrail for Agentic AI" の翻訳です。 著者:Matt Hayes AI が運用段階に入るにつれ、データ品質の重要性はかつてないほど高まっています。AI が単に成果物を出力する段階は過ぎ去りました。AI は実際のワーク... Show More本ブログは "Data Quality Is the Guardrail for Agentic AI" の翻訳です。
著者:Matt Hayes
AI が運用段階に入るにつれ、データ品質の重要性はかつてないほど高まっています。AI が単に成果物を出力する段階は過ぎ去りました。AI は実際のワークフローにおいて、開始、ルーティング、実行を担いつつあります。当社が最近発表したエージェンティック体験に対する市場の反響は、顧客・パートナー双方から非常に高く、あるパートナーは「まさに、これこそが AI に期待していた姿だ」と完璧に言い表しました。
この変化は刺激的であると同時に、リスクが急激に高まる領域でもあります。AI が行動を起こすようになると、「まあまあ良いデータ」ではもはや不十分になるのです。
その理由を実例で説明しましょう。顧客離反リスクを検知し、自動的に顧客維持ワークフローを起動する AI エージェントを想像してください。割引を提案し、担当者にケースを報告し、更新可能性の予測を最新にします。もし基盤となるアカウントデータが重複していたり、所有製品の情報が古かったり、契約ステータスが間違っていたりすると、エージェントは単に誤った洞察を生成するだけでなく、誤った行動を取ります、しかも大規模に。これが「まあまあ良いデータ」では不十分になる理由です。
AI は洞察から行動へ移行し、信頼が必須要件となる
市場は AI、生成 AI、エージェントによって加速しており、データ品質はその中心に位置します。なぜなら、信頼され管理されたデータこそが AI の取り組みを現実のものとするからです。レポートの中で特に印象に残った一節は、Gartner の戦略的予測「2027年までに、組織の 70% が AI 導入とデジタルビジネス戦略をより効果的に支援するため、最新のデータ品質ソリューションを採用する」です。これは単なる「ツールの流行」という一過性のものではなく、根本的なシフトが起きているという兆候なのです。
AI が運用段階に入ると、品質とガバナンスはもはや技術的選択肢ではなくなり、AI を大規模にかつ安全に展開できるかどうかを決定するガードレールとなるのです。
「拡張された」データ品質は単なる高速なクリーンアップではない
従来、データ品質は事後対応型のプロジェクトとして扱われてきました。データをプロファイリングし、クリーンアップし、次に進む。このモデルは機能しなくなります。なぜなら、エージェンティック AI の世界ではデータは静止しないからです。拡張されたデータ品質とは、活性化されたメタデータによって駆動される AI 強化機能を活用し、問題を早期に発見し、文脈に沿った修正を提案し、自動化可能な部分を自動化します。これにより、データが長期にわたり信頼性と実用性を維持できるのです。データ資産がハイブリッド化し、データソースが拡大し続け、AI システムが信頼できるデータを一時的ではなく継続的に必要とする状況において、これこそが積極的に求めるべきものなのです。
今年の Magic Quadrant は、AI 拡張に関する優先順位の明確な転換を示しています。もはや「あれば良い」ものではなく、成功に不可欠な要素となったのです。
エージェンティック時代において Qlik のアプローチが重要な理由
Qlik のパフォーマンスは、顧客が今まさに求めているもの、すなわちハイブリッド環境全体で品質とガバナンスを支えるメタデータ駆動型アプローチと一致していると考えます。自動化と AI 向け Qlik Trust Score により、AI 対応に向けたデータセットの適合性を評価する支援を実現しています。非構造化データの品質は今や中核要件であり、もはや新興トレンドではありません。これは当社がデータパイプラインに組み込み、買収と Qlik Answers® の導入を通じて拡大してきたものです。
エージェンティックなデータエンジニアリングプロジェクトを構築する場合、AI の基盤は重要です。それは次のような疑問への答えとなります。このエージェントが使用しているデータとその品質はどのようなものか、データの出所はどこか、適用されたルールは何か、何がいつ変更されたか、修正責任者は誰か。これが、デモは印象的だが実用化できない AI と、信頼できるデータに裏打ちされた説明責任を伴う実用化可能な AI との違いなのです。
詳細な洞察を得るにはレポートをダウンロードしてください(今年は興味深い動きもあります)。以下に私の要点をまとめます。
- まず、この分野では実行力が評価されます。データ品質がハイブリッド環境やマルチクラウド環境を毎日どこでもサポートし、大規模で確実に機能して初めて価値が生まれます。
- 次に、AI 強化機能はワークフローの中で自然に動作し、チームがルールと修正をより迅速に進めつつ、データスチュワードシップとガバナンスを適切に維持できるようにする必要があります。
- 最後に、データ品質は単発の導入ではなく継続的な運用モデルであるため、グローバルサポートと強力なパートナーエコシステムが予想以上に重要となります。単独のツールではもはや不十分です。
データとエージェンティック AI をさらに深く学びたい方は、4月 13日~15日にフロリダ州キシミーで開催される Qlik Connect へぜひご参加ください。実践的なセッションに加え、志を同じくする仲間や Qlik エキスパートとの交流の場もご用意しています。
Gartner, Magic Quadrant for Augmented Data Quality Solutions. Sue Waite, Divya Radhakrishnan, Amy Bickel, 11 February 2026.
GARTNER is a registered trademark and service mark of Gartner, Inc. and/or its affiliates in the U.S. and internationally, and MAGIC QUADRANT is a registered trademark of Gartner, Inc. and/or its affiliates and are used herein with permission. All rights reserved.
Gartner does not endorse any vendor, product or service depicted in its research publications, and does not advise technology users to select only those vendors with the highest ratings or other designation. Gartner research publications consist of the opinions of Gartner’s research organization and should not be construed as statements of fact. Gartner disclaims all warranties, expressed or implied, with respect to this research, including any warranties of merchantability or fitness for a particular purpose.
-
Qlik Learning - Live Webinars | February & March 2026
Running Table Quality Analysis in Talend Studio Tuesday, Feb 24, 20264:00–5:00 PM CET (AMER / EST-friendly) In this intermediate level webinar, partic... Show MoreRunning Table Quality Analysis in Talend Studio
Tuesday, Feb 24, 2026
4:00–5:00 PM CET (AMER / EST-friendly)In this intermediate level webinar, participants will learn how to use the Profiling perspective in Talend Studio to run a table column analysis report to better understand their data.
Register here
Qlik Sense Enterprise Scalability Tools
Friday, Mar 6, 2026
11:00 AM–12:00 PM CET (EMEA)In this advanced level webinar, participants will learn how to install, configure, and use the Qlik Sense Qlik Sense Enterprise Scalability Tools.
Register here
Book your seat now to participate live or receive the recording later.
Don’t have a subscription yet?
You can purchase an individual Qlik Learning subscription here. -
【特設サイト 】2026年、押さえておくべきデータ・AI・分析に関する 12 のトレンド
多くの企業が AI に投資しているにもかかわらず、投資利益率を高めている企業はごく少数です。何を改善すべきなのか?AI を最大限に活用するには、新たなモデルの導入が必要です。Qlik は、「DARE インテリジェングリッド」という枠組みに沿って、企業が成功するために押さえておくべき 12 のトレン... Show More多くの企業が AI に投資しているにもかかわらず、投資利益率を高めている企業はごく少数です。何を改善すべきなのか?AI を最大限に活用するには、新たなモデルの導入が必要です。
Qlik は、「DARE インテリジェングリッド」という枠組みに沿って、企業が成功するために押さえておくべき 12 のトレンドを特定しました。データ・エージェント・人間がタッグを組むことで、初めてデータ・分析・AI から真の価値を得ることができます。特設サイトでは、登録無料で 2026年のトレンド Web セミナーやスペシャル動画を視聴したり、ガイドブックをダウンロードいただけます。
-
【オンデマンド配信】どんな学生が成長する?大域的な教育データ分析に基づく修学支援の試み
本 Web セミナーシリーズでは、Qlik でデータからアクションを起こすデータ主導のビジネスで成功しているお客様より、課題から導入の経緯、デモンストレーション、活用例などをご紹介します。 ※ 視聴無料。パソコン・タブレット・スマートフォンで、どこからでもご視聴いただけます。 【オンデマンド配信】ど... Show More本 Web セミナーシリーズでは、Qlik でデータからアクションを起こすデータ主導のビジネスで成功しているお客様より、課題から導入の経緯、デモンストレーション、活用例などをご紹介します。
※ 視聴無料。パソコン・タブレット・スマートフォンで、どこからでもご視聴いただけます。
【オンデマンド配信】
どんな学生が成長する?大域的な教育データ分析に基づく修学支援の試み金沢工業大学では、2004年以降、大学のさまざまな業務の遂行や学生の管理に情報システムが利用されてきました。一方、システムに蓄積されていたデータは、各部署で局所的に分析に利用されていましたが、入学から卒業まで大域的につないで、どのような学生が成長しているのか、もしくは修学に躓くのかを明らかにすることには利用されていませんでした。その中、2021年に文部科学省からの補助金を得て、大学全体のデータを接続し、Qlik Sense を導入して大域的な分析を行うプラットフォームを構築しました。このことにより、学生の学びのプロセスをより詳細に分析できるようになり、学生の成長をデータに基づきながら支援できるようになっています。
本 Web セミナーでは、プラットフォームの構築や分析手法、結果に基づく学生の修学支援の内容について、お話しいたします。また、導入の経緯や今後の展望などについて、クリックテック・ジャパンの公共担当営業との対談で詳しくお話しいたします。 -
Qlik Talend Cloud and Qlik Stitch: Upcoming Xero API Changes effective April 28t...
Xero has announced the deprecation of several Accounting API objects, effective 28th of April 2026. These changes will impact existing Qlik Talend Clo... Show MoreXero has announced the deprecation of several Accounting API objects, effective 28th of April 2026. These changes will impact existing Qlik Talend Cloud and Qlik Stitch Xero connectors.
What exactly is changing?
The following objects will be deprecated by Xero:
- Employees
- This object will be fully removed
- There is no replacement object
- Data for the Employees table will no longer be available after deprecation
- For more information, see Employees (Deprecated) | developer.xerox.com
- Expense Claims and Receipts
- Xero recommends using the Invoices object as a replacement
- Customers must enable the Invoices table to continue receiving equivalent data
- For more information, see Expense Claims (Deprecated) | developer.xerox.com and Receipts (Deprecated) | developer.xerox.com
What action is Qlik taking?
To support customers ahead of the deprecation date, Qlik plans two minor connector releases:
26 March 2026
This update introduced intentional failures designed to prompt you to take action before the endpoint is removed:
- Connections that have Employees, Expense Claims, or Receipts selected will begin to fail post-sync
- To minimize disruption and inbox noise, failures will occur no more than once per week per connection
27 April 2026
All references to the Employees, Expense Claims, and Receipts endpoints will be fully removed from the connector.
From this date forward:
- Employees data will no longer be available
- Expense Claims and Receipts data will only be accessible via the Invoices table (if enabled)
If you have any questions, we're happy to assist. Reply to this blog post or take your queries to our Support Chat.
Thank you for choosing Qlik,
Qlik Support - Employees
-
Successful Hackathon at Anurag University
The Department of Data Science, Anurag University, organized another successful hackathon, "Data Dynamo 2.0" on January 30-31, 2026 where a number of ... Show MoreThe Department of Data Science, Anurag University, organized another successful hackathon, "Data Dynamo 2.0" on January 30-31, 2026 where a number of students from the city of Hyderabad and Telangana State participated.
The event marked a significant initiative to bring aspiring data enthusiasts from diverse educational institutions together. Designed with the dual purpose of promoting experiential learning and encouraging innovative problem-solving, the hackathon provided a platform for students to apply theoretical knowledge to real-world data challenges. The hackathon was conducted across the following domains: Web/App Dev, AI/ML & LLMs, Data Analytics, IoT, and Blckchain/Cybersecurity.
Qlik was associated with the data analytics domain.
Beyond technical rigor, the event fostered collaboration, creativity, and intellectual growth, making it a great learning experience. This Hackathon was conducted under the leadership and guidance of Dr.M.Sridevi, Head of the Department, Data Science, Ms. B. Jyothi, Assistant Professor, Data Analytics Technical Club Convener, Mr.Salar Mohammad, Datum Technical Club Convener.
The total number of students participating in this Hackathon was more than 600 across 190 teams.
The number of students participating in the Qlik domain for data analytics was 150.
Students who participated in the Qlik domain were oriented about the basics of Qlik Sense along with explaining the key features and building dashboards, through two bootcamps. These camps were conducted by Qlik Educator Ambassador, Manikant Roy from Jaipuria Institute of Management and former student and winner of last year's Datathon, Moguluri Koushik.
Participating students registered for the Qlik Academic Program so that they have access to the free software, training and qualifications. The software was used during the datathon and the training helped them build apps and dashboards.
Winners: Visionary coders, Anurag UniversityFirst Runner Up : Dediocons, Anurag UniversitySecond Runner Up : Coding Rats, Srinidhi Institute of Technology,Hyderabad -
【オンデマンド配信】トレンドを語る:AI の勢いを持続的なビジネス成果へ
AI の勢いを持続的なビジネス成果へ アジア太平洋地域全体で AI の勢いが高まっている中、ビジネスでの試験的な活用が進み、期待も高まっています。 課題は、「AI の適用開始」ではなく「持続」です。多くの企業で AI 戦略の障壁となっているのは、テクノロジーの問題ではありません。サイロ化されたデー... Show MoreAI の勢いを持続的なビジネス成果へ
アジア太平洋地域全体で AI の勢いが高まっている中、ビジネスでの試験的な活用が進み、期待も高まっています。
課題は、「AI の適用開始」ではなく「持続」です。多くの企業で AI 戦略の障壁となっているのは、テクノロジーの問題ではありません。サイロ化されたデータ、レガシー環境の複雑性、人材のスキル不足、不明瞭な意思決定です。
Web セミナー「トレンドを語る:AI の勢いを持続的なビジネス成果へ」にご参加ください。分断や見えないリスクを回避して AI の勢いを行動につなげるには?アジア太平洋地域の企業が押さえておくべき 2026年のトレンドについて、データのエキスパートが議論します。
本 Web セミナーでは、試験段階から本番運用への移行、スピードと信頼のバランス、全社展開を支える基盤の構築など、実際の現場に適用できるポイントを中心に掘り下げます。
※ 視聴無料。パソコン・タブレット・スマートフォンで、どこからでもご視聴いただけます。
-
データをエージェンティック AI の原動力に(Qlik Blog 翻訳)
本ブログは "How to Make Data Work for Agentic AI" の翻訳です。 著者:Brendan Grady 数十年にわたり、組織はデータを活用してより良い意思決定を行い、成果を向上させる取り組みを続けてきました。データはビジネスの生命線となり、AI は今や新たな方... Show More本ブログは "How to Make Data Work for Agentic AI" の翻訳です。
数十年にわたり、組織はデータを活用してより良い意思決定を行い、成果を向上させる取り組みを続けてきました。データはビジネスの生命線となり、AI は今や新たな方法でその可能性を解き放つ力を備えています。ダッシュボードやビジュアルインターフェースから AI 駆動の体験へと、パラダイムは移行しつつあるのです。
しかし、依然として大量のデータがサイロ化され、不完全で不正確なまま放置されている現実があります。多くの分析ワークフローは手作業に依存したままであり、これが価値創出までの時間を遅らせ、インサイトの質を制限し、コストを押し上げています。AI 支援作業でさえ停滞することがあります。なぜなら、アナリストは依然として入力データを集め、正確な質問を投げかけなければ答えに辿り着けないからです。
もし AI が、安全かつ確実に、より多くの重労働を担うことができたらどうでしょう?
それが「エージェンティックAI」の約束であり、急速に現実のものとなりつつあります。エージェンティック AI は、多段階の問題を推論し、アプローチを適応させ、最小限の人間の関与で目標達成に必要な能力を活用できます。適切に運用されれば、インサイトの加速とコスト削減を実現し、チームが手作業ではなくビジネスの遂行に集中できるよう支援します。
Qlik のビジョンは、人間のように協調するエージェントのインテリジェントネットワークです。問題を分解し、適切なリソースとデータを収集し、意思決定を行い、最適な次行動を実行します。
発表内容
本日、構造化データ分析、非構造化知識、異常検知、ヘルプ&アシスタンス向けのターンキーエージェントを含む、新たなエージェンティック体験を提供開始します。さらに、サードパーティ製 AI アシスタントが Qlik の機能を活かしたカスタム AI ソリューション構築を可能にする MCP サーバーを導入します。
当社のエージェントを利用する場合も、MCP 経由で Qlik にアクセスする場合も、Qlik の独自の機能により AI の真の可能性を最大限に引き出せます。
信頼性の高いデータ製品は、AI 向けに厳選された高品質データセットであり、タイムリーで正確かつガバナンスの効いた基盤を構築します。当社独自の分析エンジンは、高速かつコスト効率の高い計算で思考連鎖を可能にし、新たなレベルの文脈理解を実現することで、そのデータを活用します。これらを統合することで、当社のエージェンティック体験が実現され、データ・エージェント・アシスタント・プラットフォームを統合し、強力な分析、多段階タスクの自動化、複雑な目標達成を可能にします。
入り口は2つ設けられています。
- Qlik から:当社の AI アシスタント「Qlik Answers」は、分析エンジンとデータ製品を基盤とした統合インターフェースです。そのため、回答は迅速で説明可能、かつコンテキストに基づいています。チームが既に信頼しているものを再構築することなく、迅速に価値を実感できるよう設計されています。
- 既存のアシスタント経由で:当社の MCP Server は、ガバナンスと監視機能を備えつつ、Qlik のエージェント機能をサードパーティ製 AI アシスタントやエージェント開発環境に提供します。お客様は選択したアシスタントを利用でき、Qlik は信頼できるデータ基盤、文脈豊かな分析、管理されたアクションパスを提供します。
提供状況
すでに一般提供を開始しています。Qlik Answers(Qlik 内の AI アシスタント)は提供開始されました。また、MCP Server は外部アシスタントやカスタムビルドを通じて Qlik への管理されたアクセスを提供します。
Qlik Cloud Analytics Premium/Enterprise および Qlik Sense Enterprise SaaS に付属する「Data Products for Analytics」は、これらの体験を支える厳選されたタイムリーで正確な管理対象データセットとしてまもなく提供開始します。さらに「Discovery Agent」がディメンション横断的な KPI を監視し、有意な変化を検知。ユーザーは発見結果を直接 Qlik Answers で確認することが可能になります。
データを AI の原動力に
これらの発表は、3つの実践的な方法で当社の約束を強化します。Qlik は単なる基盤ではありません。基盤に注力しつつ、より優れたビジネス成果の実現を推進しています。
- AI の実現:Qlik Answers は信頼できる回答を Qlik にもたらし、MCP はチームが好みのアシスタントを使い続けられるようにします。その間も Qlik はガバナンスとコンテキストを保持します。
- AI の加速:顧客は Qlik データモデルとビジネスロジックに数千時間を投資しています。この基盤を強化することで、価値を迅速に実証し、AI の利用拡大に伴い拡張できます。
- AI の適応:エージェンティック体験は単一のアシスタント、ベンダー、スタックでは成り立ちません。当社のアーキテクチャは相互運用性を設計に組み込んでおり、顧客は一からやり直すことなく進化できます。
プライベートプレビューで得られた知見
実際の顧客環境、現場のリアルデータ、実際の役割、具体的な課題のもとで迅速に学ぶため、エージェンティック体験をプライベートプレビューで提供しました。特に顕著だった事例をいくつかご紹介します。
- 営業責任者は「今四半期の契約更新にどのような変化があったか?次に何をすべきか?」と問いかけました。価値は、要因、セグメント、関連する背景情報を一元的に把握し、それを次の顧客との対話に向けた計画に転換できた点にあります。
- 運用チームはサービス問題の急増を調査し、複数のアプリや文書を繋ぎ合わせる必要なく、「何か異常が起きている」状態から「集中している箇所」「相関関係」「最初に確認すべき事項」へと迅速に移行しました。
- 財務チームはトレーサビリティを徹底的に追求し、説明と数値の整合性を図り、「証拠を見せてほしい」という声に対応しました。信頼は回答を説明できる能力に依存するからです。
ベンチマーク調査でもこれを実証しました。構造化データ向け Qlik Answers と主要競合製品を比較した社内ベンチマークでは、Qlikは 69.6% の精度(競合65.2%)を達成。さらに「質問1件ごとに課金」というシンプルな価格体系と、単なるクエリ出力ではなく洞察に富んだ回答に重点を置いた点が評価されました。
アクセス、アクティベーション、およびアップグレードパス
特に迅速な移行を希望されるお客様向けに、導入が容易な設計としています。
- Qlik Cloud Analytics をご利用のお客様:MCP Server は 2 月 10 日より全世界で提供開始、Qlik Answers は 2 月 10 日より AWS リージョンごとに順次提供開始となります。Data Products は 2 月 24 日に提供開始、Discovery Agent はその後提供開始予定です。
- Qlik Sense Enterprise SaaSをご利用のお客様:MCP Server は 2月 10日より全世界で提供開始。Qlik Answers は 2月 24日、Data Products は 2月 24日提供開始、Discovery Agent はその後間もなく提供開始となります。
- フルスケールでの容量ベースのエージェント機能をご希望の場合:アカウント担当チームが Qlik Cloud Analytics 容量ベースへのアップグレードパスをご案内します。これは Qlik Cloud Analytics と Qlik Talend Cloud 全体での広範な導入基盤となります。
- オンプレミス環境をご利用の場合:妥協や再構築は不要です。クラウド移行プランでエージェント機能を解放し、2026年にはガバナンスを維持しつつ、段階的・実践的・価値主導の移行計画で顧客を支援します。
私の見解
AI の進化はモデル開発の段階を既に超えています。真の課題は、AI を信頼性が高く説明可能で業務フローにおいて有用なものにすることです。分析と知識を結びつけられず、次の行動を統制できない場合、それは自律型 AI ではなく、説明責任のない自動化に過ぎません。
「AIのためにデータを活用する – データを 人工知能 の原動力に」とはまさにこういうことです。 -
Qlik Bump Chart: a custom extension to visualize ranking evolution over time
When building dashboards that involve any kind of leaderboard or competitive comparison, it’s always good to show how rankings shift over time. Not ju... Show MoreWhen building dashboards that involve any kind of leaderboard or competitive comparison, it’s always good to show how rankings shift over time. Not just "who's #1 right now," but the full story: who climbed, who dropped, when the shift happened.
Qlik Sense doesn't have a native bump chart. The usual workaround is a line chart with pre-calculated ranks, but I wanted to push this further and add some more interactivity and options.
The idea for creating this extension came after doing some updates on the Formula1 web app which uses a native D3.js chart, so I wanted to transfer that code over to a Qlik Sense extension that can be reused in other apps.
The extension makes it easy for you. You just add two dimensions and one measure, and it takes care of everything else: ranking, time sorting, labels, hover highlighting, and field selections. The object properties will let you customize it to your needs.
In this post I'll walk through what it does, how it's structured, and how you can use it for various use cases.
Github Repo: https://github.com/olim-dev/qlik-bump-chartWhat is a Bump Chart?
A bump chart shows how entities change position relative to each other over time. Each entity gets a colored line. Rank #1 sits at the top. As rankings shift, lines cross, and you immediately see who's moving up, who's falling, and when an overtake happens.
What can you do with this extension?
- Track rankings over any time dimension (quarters, months, weeks, laps)
- Highlight top performers, bottom performers, or biggest movers automatically
- Toggle between rank mode (auto-calculated) and position mode (raw measure as Y-axis)
- Replay the line-drawing animation
- Click labels or lines to make Qlik selections
- Customize everything: line style, dot size, colors, labels, grid, tooltips
Use Cases
The pattern is always the same: entities, time periods, and a measure.
- Sales: rep leaderboard over months
- Marketing: brand awareness tracking, campaign effectiveness over quarters
- Finance: fund performance rankings
- HR: employee performance trends, team productivity rankings
- Operations: supplier quality rankings, efficiency metric evolution
- Sports: league standings, player rankings across a season, F1 race position over laps
How to set it up
Add two dimensions and one measure:
- Dimension 1: the entity to rank (Product, Sales Rep, Team, Driver)
- Dimension 2: the time period (Quarter, Month, Week, Lap)
- Measure: the value that determines rank (Sum(Sales), Avg(Score), Max(Position))
I have attached a Text file with some sample datasets that you can inline-load in a new app to test it.Quick tour of the object properties
The property panel has clear labels for which dimension goes on which axis. Here are the sections that matter most:
Chart Settings: Maximum Entities (2-30, sweet spot is 8-15), Rank Direction (highest or lowest value = #1), Line Style (smooth, straight, step).
Position Mode: Instead of auto-calculating ranks, use the raw measure value as the Y position. Great for race data where position is already known.
Labels: Position them on the right, left, or both sides. Rank change indicators (triangle arrows) show how many spots an entity moved. Clicking a label triggers a Qlik selection.
Highlight: Automatically highlight top N, bottom N, or biggest movers with a configurable glow color.
Colors: Six built-in palettes (Vibrant, Qlik Classic, Category 10, Extended 20, Cool, Warm) plus a custom background color.
Animation: Toggle transitions on/off, adjust duration (100-1500ms), and a "Replay Animation" button to re-run the line-drawing effect.
Selections: Toggle selections on/off
The extension folder structure
qlik-bump-chart/
qlik-bump-chart.qext Extension definitions
qlik-bump-chart.js Main entry (Qlik lifecycle, paint, selections)
qlik-bump-chart-properties.js Property panel definition
qlik-bump-chart-renderer.js D3 rendering engine
qlik-bump-chart-data.js Data processing, ranking, time sorting
qlik-bump-chart-constants.js Defaults, palettes, timing values
qlik-bump-chart-style.css All CSSlib/
d3.v7.min.js D3.js v7- The main JS handles the Qlik lifecycle.
- The data module processes the hypercube, sorts time periods, and calculates ranks.
- The renderer draws everything with D3.
- The properties file defines the right-panel UI.
- The constants file holds all defaults, color palettes, and timing values in one place.
Tips
- Limit entities to 8-15 for readability. More than that and lines become hard to follow.
- Use Highlight Mode to draw attention to the story (top performers, biggest movers).
- Position Mode is great for pre-calculated position data like F1 race results.
- Pair with a table or KPI object nearby for exact values at glance.
Let me know in the comments if you have any questions or feedback!
Thanks for reading.
Ouadie
-
Platform Operations with Qlik Application Automation
This video shows you how to use Qlik Application Automation to perform common Platform Operations on your Qlik Cloud tenant. This can come in especial... Show MoreThis video shows you how to use Qlik Application Automation to perform common Platform Operations on your Qlik Cloud tenant. This can come in especially handy if you need to manage multiple Qlik Cloud tenants.
Resources:
Support Article: https://community.qlik.com/t5/Official-Support-Articles/Qlik-Application-Automation-How-to-get-started-with-the-Qlik/ta-p/2038740
About OAuth https://qlik.dev/authenticate/oauth
-
Iceberg Lakehouse Myths Debunked: What You Really Need to Know
Modern data world is buzzing with statements like: “Iceberg is the future of the lakehouse.” “Iceberg is basically a data warehouse on S3.” “Iceberg ... Show MoreModern data world is buzzing with statements like:
- “Iceberg is the future of the lakehouse.”
- “Iceberg is basically a data warehouse on S3.”
- “Iceberg is just Delta Lake but open.”
- “If you’re doing CDC, you need Iceberg.”
- ...
The reality is: Iceberg is an extremely powerful technology — but it’s also one of the most misunderstood.
And those misunderstandings matter. They lead teams to build the wrong architecture, expect warehouse-like performance overnight, or avoid Iceberg entirely because they assume it’s “only for big data companies.”
So let’s clear the air.
Here are the biggest myths about Apache Iceberg and the lakehouse — and what’s actually true.
Myth #1: Iceberg is just a file format (or “just Parquet with metadata”)
This is probably the most common misunderstanding.
Iceberg is not a storage format like Parquet or ORC. Parquet defines how data is stored inside files. Iceberg defines how those files are managed as a table.
Iceberg provides a full table abstraction including:
- snapshot-based versioning
- atomic commits
- partition evolution
- schema evolution
- metadata-driven planning
- support for deletes, updates, and merges
In other words, Iceberg isn’t “a better Parquet.” It’s the layer that makes object storage behave more like a database/data warehouse.
Iceberg is a database-like table abstraction for a data lake. That’s why it’s such a powerful building block for lakehouse architecture.
Myth #2: Iceberg replaces your data warehouse
This is probably one of the most debated topics in the lakehouse world. Some people hear “Iceberg lakehouse” and assume the conclusion is obvious: “So Iceberg replaces Snowflake / Redshift / BigQuery?”
Reality: Iceberg is increasingly replacing the warehouse as the storage layer, but not always replacing the warehouse as a query engine.
Iceberg enables organizations to store data in open object storage while still gaining database-like capabilities such as transactional updates, schema evolution, atomic commits and consistent reads.
On its own, Iceberg is “just” a table format. But the ecosystem around Iceberg has evolved rapidly. Managed lakehouse solutions like Qlik Open Lakehouse, and Snowflake-managed Iceberg tables (along with catalogs like Glue, Polaris, and others) now provide many of the features that teams historically depended on data warehouses for:
- managed compute and scaling
- automated optimization and compaction
- governance via centralized catalogs
- access control and auditing
- growing BI ecosystem compatibility
This is why the modern architecture trend is shifting toward a new model:
- Iceberg becomes the system of record (storage layer)
- multiple compute engines (including warehouses) query Iceberg directly
- workloads gradually shift away from warehouse-managed storage to the open lake storage
- data duplication across systems becomes optional, not mandatory
- warehouses increasingly act as one of many query engines
So Iceberg doesn’t always eliminate warehouses — but it does change their role dramatically.
Iceberg isn’t just competing with warehouses. It’s redefining them. "Iceberg is replacing the warehouse as the storage layer, while warehouses increasingly become just another compute engine.”
Myth #3: Iceberg automatically solves performance
Iceberg enables performance. It doesn’t magically deliver it.
Yes, Iceberg introduces powerful capabilities such as:
- metadata pruning
- partition pruning without hard-coded directory structures
- snapshot planning
- table statistics
- faster planning for large datasets
But Iceberg is not a “set it and forget it” system. Performance still depends heavily on operational practices:
- compaction (small file management)
- partitioning strategy and partition evolution
- clustering / sorting
- snapshot expiration and metadata cleanup
- compute engine choice (Spark vs Trino vs Flink, etc.)
This is where many teams get surprised. They adopt Iceberg expecting instant warehouse-like performance, but forget that warehouses continuously optimize tables behind the scenes.
In the Iceberg world, that optimization work must be done either:
- by your platform team, or
- by a managed lakehouse solution (such as Qlik Open Lakehouse, or other managed Iceberg platforms)
Without this, even an Iceberg-based lakehouse can degrade over time into something that looks like the old data lake problem: too many files, slow queries, rising compute cost, and unpredictable performance.
Iceberg isn’t a magic speed button.
It’s a system that makes optimization possible and sustainable but only with operational discipline.Myth #4: Iceberg is only for huge data volumes
This myth is surprisingly common, especially among teams who associate Iceberg with “big data” platforms.
But Iceberg is not only valuable at petabyte scale.
Even smaller organizations benefit because Iceberg solves painful operational problems that show up early:
- schema changes breaking pipelines
- inconsistent reads across jobs
- unreliable partitioning logic
- lack of rollback when data is corrupted
- messy S3 folder conventions
- hard-to-manage incremental loads
But the biggest reason Iceberg matters early isn’t scale — it’s interoperability. And,
Interoperability = future-proofing
Iceberg lets you store your data once in object storage and query it from multiple engines: Spark, Trino, Flink, Athena, and even modern warehouses: Snowflake, Databricks, Redshift.
That means you don’t have to copy and duplicate datasets across multiple warehouses, marts, or analytics platforms just to support different teams and tools. You avoid building an architecture where every new use case requires another data copy.
This becomes even more important as you grow. Most organizations start with one analytics tool — but over time they add BI workloads, ML pipelines, real-time ingestion, governance requirements, and multiple compute engines.
If your data foundation is closed or warehouse-specific, growth often forces a painful redesign. Iceberg helps you avoid that. It’s about building a data architecture that won’t force you to rebuild everything when you grow.
Iceberg isn’t about big data. It’s about reliable tables on object storage.
And yes — cost matters
Iceberg doesn’t just reduce storage cost. It reduces the bigger hidden cost in data platforms:
duplicating the same datasets across multiple systems.
Even at smaller scale, fewer copies means less ETL, less operational overhead, and fewer expensive warehouse storage footprints.
Myth #5: Iceberg is only for CDC (streaming ingestion)
Iceberg is often discussed alongside Debezium, Kafka, Flink, and incremental ingestion pipelines. That leads many people to believe:
“Iceberg is mainly for CDC pipelines.”
CDC is a great use case — but it’s not the whole story.
Iceberg works extremely well for traditional workloads too:
- batch ETL pipelines
- curated data marts
- BI reporting datasets
- ML feature tables
- audit-friendly datasets requiring reproducibility
- GDPR deletes and corrections
- incremental batch pipelines (even without Kafka)
Streaming ingestion is one reason Iceberg is popular, but Iceberg’s real strength is broader:
it brings transactional table management and consistent reads to the data lake.
CDC is a use case. Iceberg is the table layer.
The Real Story: What Iceberg Actually Gives You
Iceberg is best understood as a modern table system designed for object storage. It provides three major outcomes:
- Reliability
Atomic commits, consistent snapshots, and rollback capability.
- Flexibility
Multi-engine access across Spark, Trino, Flink, Athena, and more.
- Long-term scalability
Metadata-driven planning, partition evolution, and manageable table growth.
This is why Iceberg has become so central to lakehouse architecture. It’s not just a format. It’s not just for streaming. It’s not only for “big data.”
It’s a way to make your data lake behave like a real platform — a buffet-style platform where you can pick the tools and engines that work best for each use case.
If you’re exploring Iceberg adoption, table maintenance strategies, or lakehouse architecture patterns, feel free to reach out or connect — I’d love to compare notes.
-
🚀 New to Qlik Learning?
Whether you're just getting started or looking to make the most of Qlik Learning, this session will help you confidently navigate your learning journe... Show MoreWhether you're just getting started or looking to make the most of Qlik Learning, this session will help you confidently navigate your learning journey, build the right skills faster, and stay on track toward certification.
🔎You’ll Learn How To:
✅ Navigate Qlik Learning with ease
✅ Assess your current skills and discover curated learning paths
✅ Track your progress and stay motivated
✅ Prepare for certification👥 Who Should Attend?
✅ New users and administrators
✅ Existing users who want to rediscover and maximize Qlik LearningRegister for an Upcoming Webinar
Log in to Qlik Learning and under Course Sessions, access the Welcome to Qlik Learning webinar, and register for an upcoming webinar that works for you:
Don’t miss this opportunity to accelerate your skills and get the most out of Qlik Learning.
We look forward to seeing you there!

-
Introducing Agentic AI with Qlik
Qlik's Agentic experience is here. The Qlik Agentic experience introduces a unified conversational interface for working with data and analytics, del... Show MoreQlik's Agentic experience is here.
The Qlik Agentic experience introduces a unified conversational interface for working with data and analytics, delivering fast, explainable, context-aware responses through Qlik Answers. It also enables customers to securely use external LLMs with trusted Qlik data with our MCP server, and includes specialized agents that automate analysis and action—while allowing users to stay in their preferred AI interface.
And it is, of course, underpinned by Qlik's core strengths:
- Trusted data products built from high-quality, governed data
- Our unique analytics engine optimized for fast, incremental calculations supporting chain-of-thought reasoning
- An open agentic architecture that allows both Qlik agents and third-party AI assistants to tap into the full range of Qlik capabilities
With this launch:
- Qlik Answers becomes your unified agentic AI assistant, reasoning across structured and unstructured data with the power of AI’s knowledge and capability to deliver insight, assistance, and automation.
- Qlik MCP server delivers the power of Qlik to third-party AI assistants for building custom agentic solutions powered by governed data and our unique analytics engine.
- Discovery Agent will provide always-on anomaly and change detection, proactively surfacing meaningful, high-priority outliers and anomalies through a simple insights feed. Available in March.
- Data products in Analytics extend data products and quality capabilities into the analytics workflow, strengthening the foundation for agentic AI. Available February 24th.
You can read about all four launch highlights in our Innovation Blog post, Qlik’s Agentic Experience is Here, where we'll walk you through the details on each.
And when you're ready to get started and learn more, explore our resources:
- What’s New in Qlik Cloud | Qlik Help
- Qlik Answers | Qlik Help
- Deploying and administering Qlik Answers | Qlik Help
- Best practices for creating and managing assistants and knowledge bases | Qlik Help
- Best practices for preparing applications for Qlik Answers | Qlik Help
- Qlik MCP Server | Qlik Help
- Deploying and administering Qlik MCP server
- Qlik Answers Agentic Experience FAQ | Community Article
- Qlik Model Context Protocol (MCP) FAQ | Community Article
Ready? Turn on AI Features in your tenant's Qlik Cloud Administration Center > Settings!
Thank you for choosing Qlik,
Qlik Support -
New Qlik Sense Enterprise on Windows patches available to address post-upgrade O...
The patches resolving the post-upgrade ODBC-based connectors issue announced in this blog post have been released today. Check the download page for t... Show MoreThe patches resolving the post-upgrade ODBC-based connectors issue announced in this blog post have been released today.
Check the download page for the following releases:
- Qlik Sense Enterprise on Windows November 2025 Patch 3 (Release Notes)
- Qlik Sense Enterprise on Windows May 2025 Patch 13 (Release Notes)
- Qlik Sense Enterprise on Windows November 2024 Patch 25 (Release Notes)
For more information, see Upgrade advisory for Qlik Sense on-premise November 2024 through November 2025: ODBC-based connectors.
If you have any questions, we're happy to assist. Reply to this blog post or take your queries to our Support Chat.
Thank you for choosing Qlik,
Qlik Support