Unlock a world of possibilities! Login now and discover the exclusive benefits awaiting you.
Announcements
Join us at Qlik Connect for 3 magical days of learning, networking,and inspiration! REGISTER TODAY and save!
- Qlik Community
- :
- Discover
- :
- Blogs
- :
- Product
- :
- Design
- :
- Bike.qlik.com - The beauty of Qlik's Open Source w...
Employee
2018-04-27
10:04 AM
- Subscribe to RSS Feed
- Mark as New
- Mark as Read
- Bookmark
- Subscribe
- Printer Friendly Page
- Report Inappropriate Content

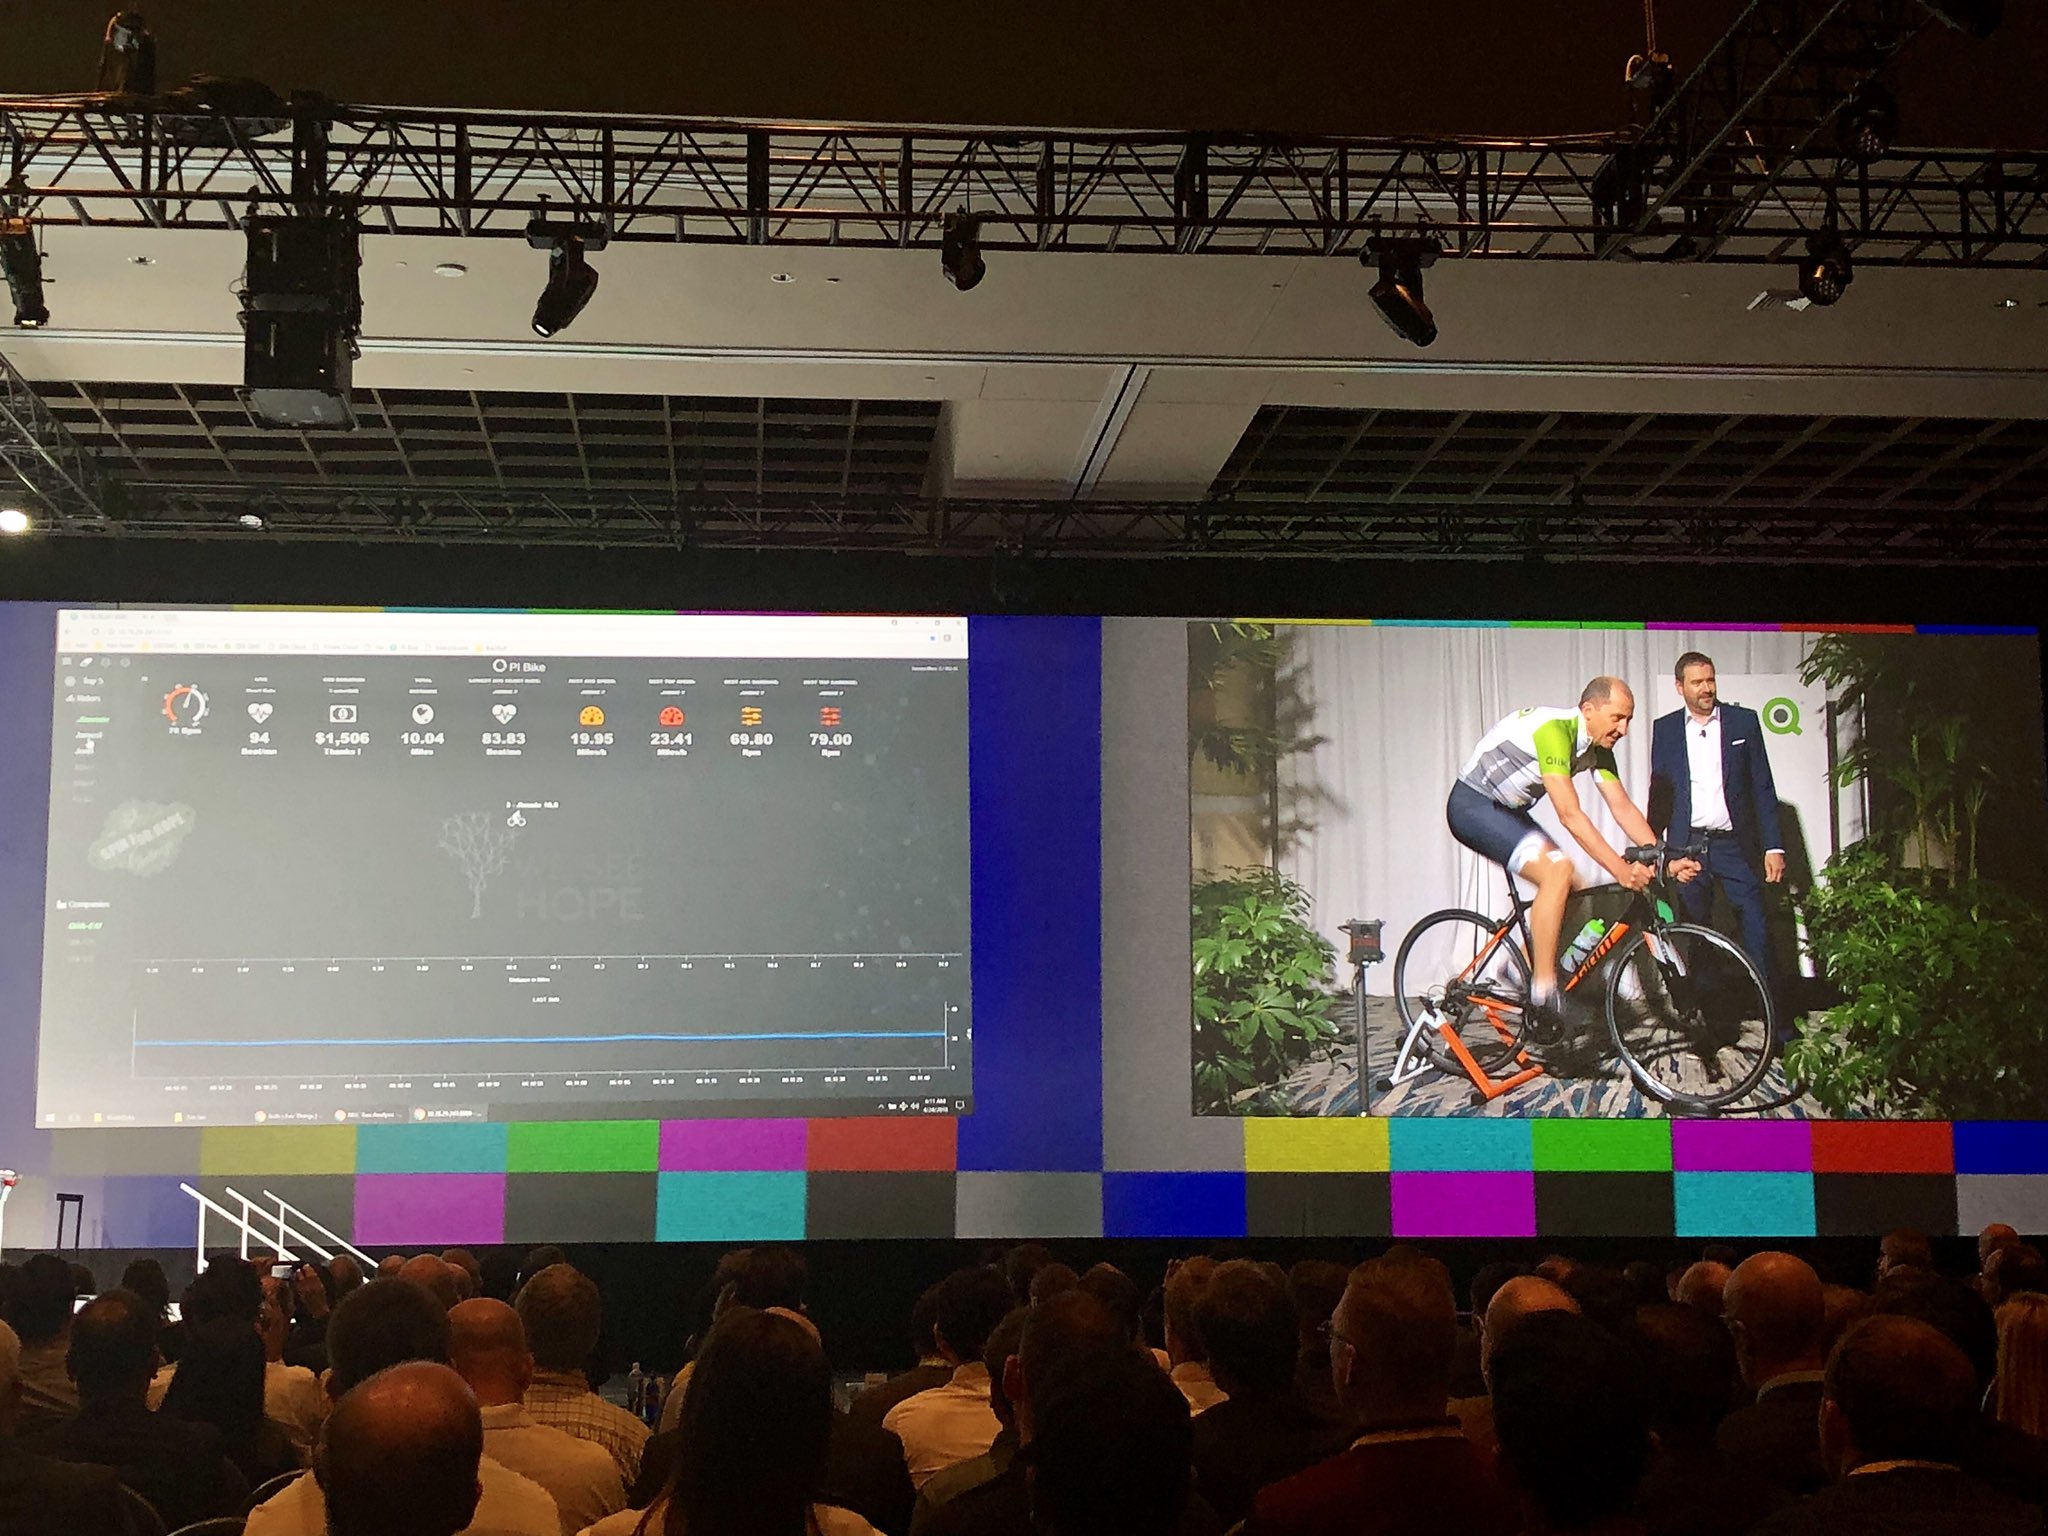
Hopefully you all attended Qonnections 2018 and saw Jimmie on the bike ![]() !!!
!!!

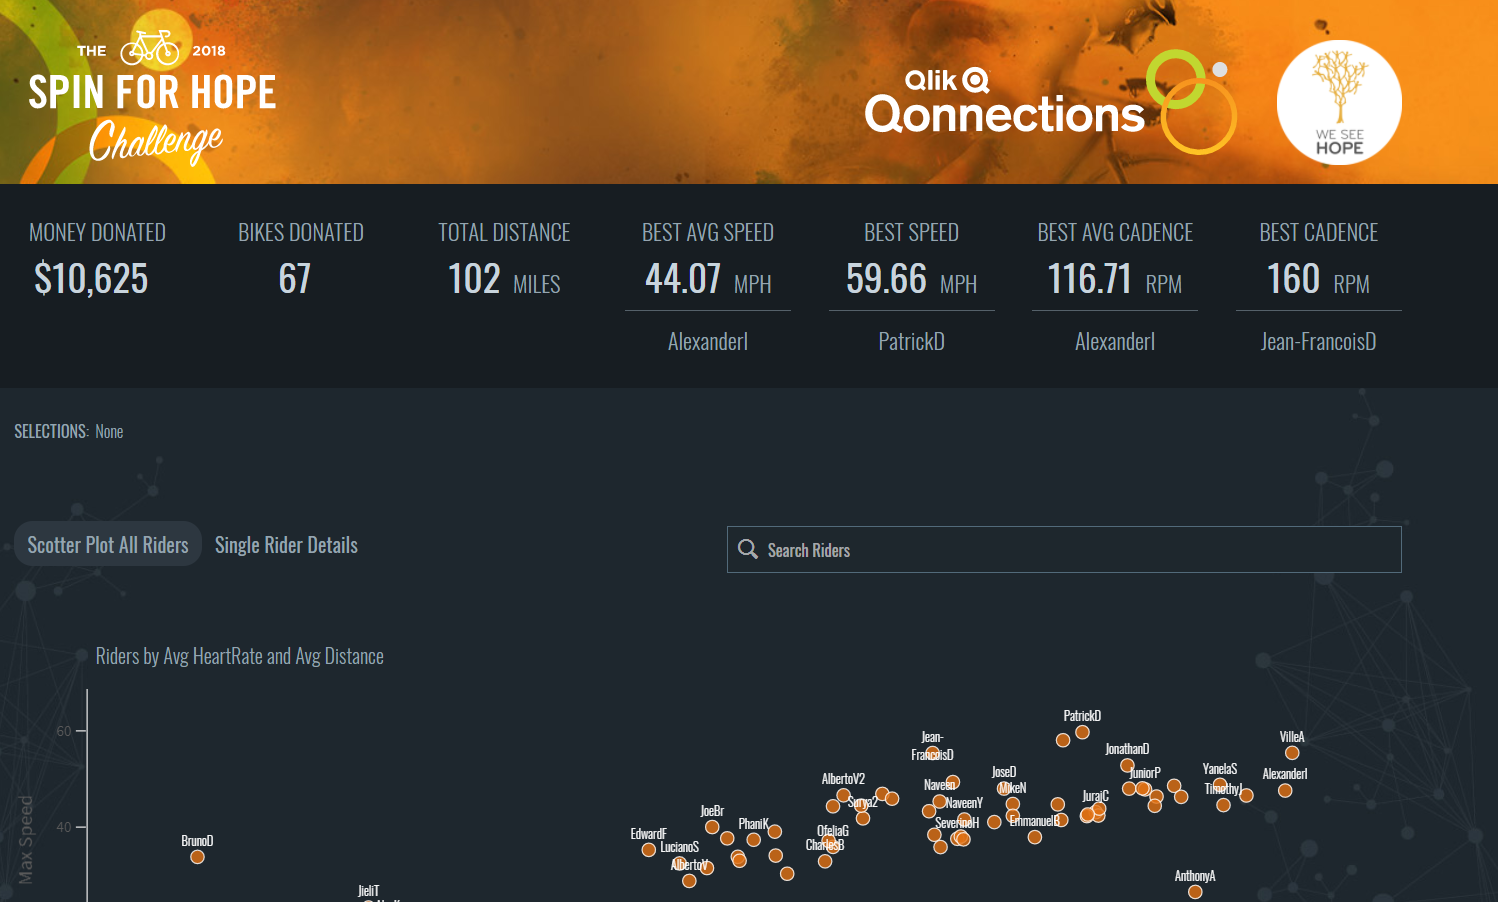
Bike.qlik.com is the latest mashup build entirely with Qlik's open source libraries, Qlik Core, Enigma.js, Picasso.js, Leonardo UI and the Demo Team's Qdt-components.

Here is briefly how we did it
- Sensors are sending data wireless to the Raspberry Pi
- Node.js reads and writes csv
- Qlik Core in Raspberry Pi is reading csv with a reload script and saves the data
- Enigma.js connects and gets the data from Qlik Core then, Picasso.js is displaying that data in a graphical format
- Node.js is uploading the qvds on Bike.qlik.com
- Bike.qlik.com is a Docker that runs 2 containers in an AWS EC2 instance. One for the Qlik Core / Engine and another for an apache server
- The htdocs and the Apps for the Qlik Core, are mounted outside of the 2 containers so there is no need to reload containers or recreate the Docker images, once the html code is changed or the qvf
- Once uploaded, a Node.js restful api endpoint is reloading the session app, reads the new data from the just uploaded qvds and saves the qvf with the new data
- React.js with Qdt-components is connecting to Qlik Core on the server and is getting the data
- Qdt-components is rendering 11 KPI components and one search component (Leonardo UI) on the Rider field
- Picasso.js is used to read the data and display a scatter plot and a line chart with tooltip and multiple selections
Expect more examples in the coming future with these combinations of our Open Source Software!!!!!
Yianni
8 Comments
You must be a registered user to add a comment. If you've already registered, sign in. Otherwise, register and sign in.