Announcements
Join us at Qlik Connect for 3 magical days of learning, networking,and inspiration! REGISTER TODAY and save!
Yianni_Ververis
Employee
Employee

Tshirt_Student_Fair_OSS-V2.jpg


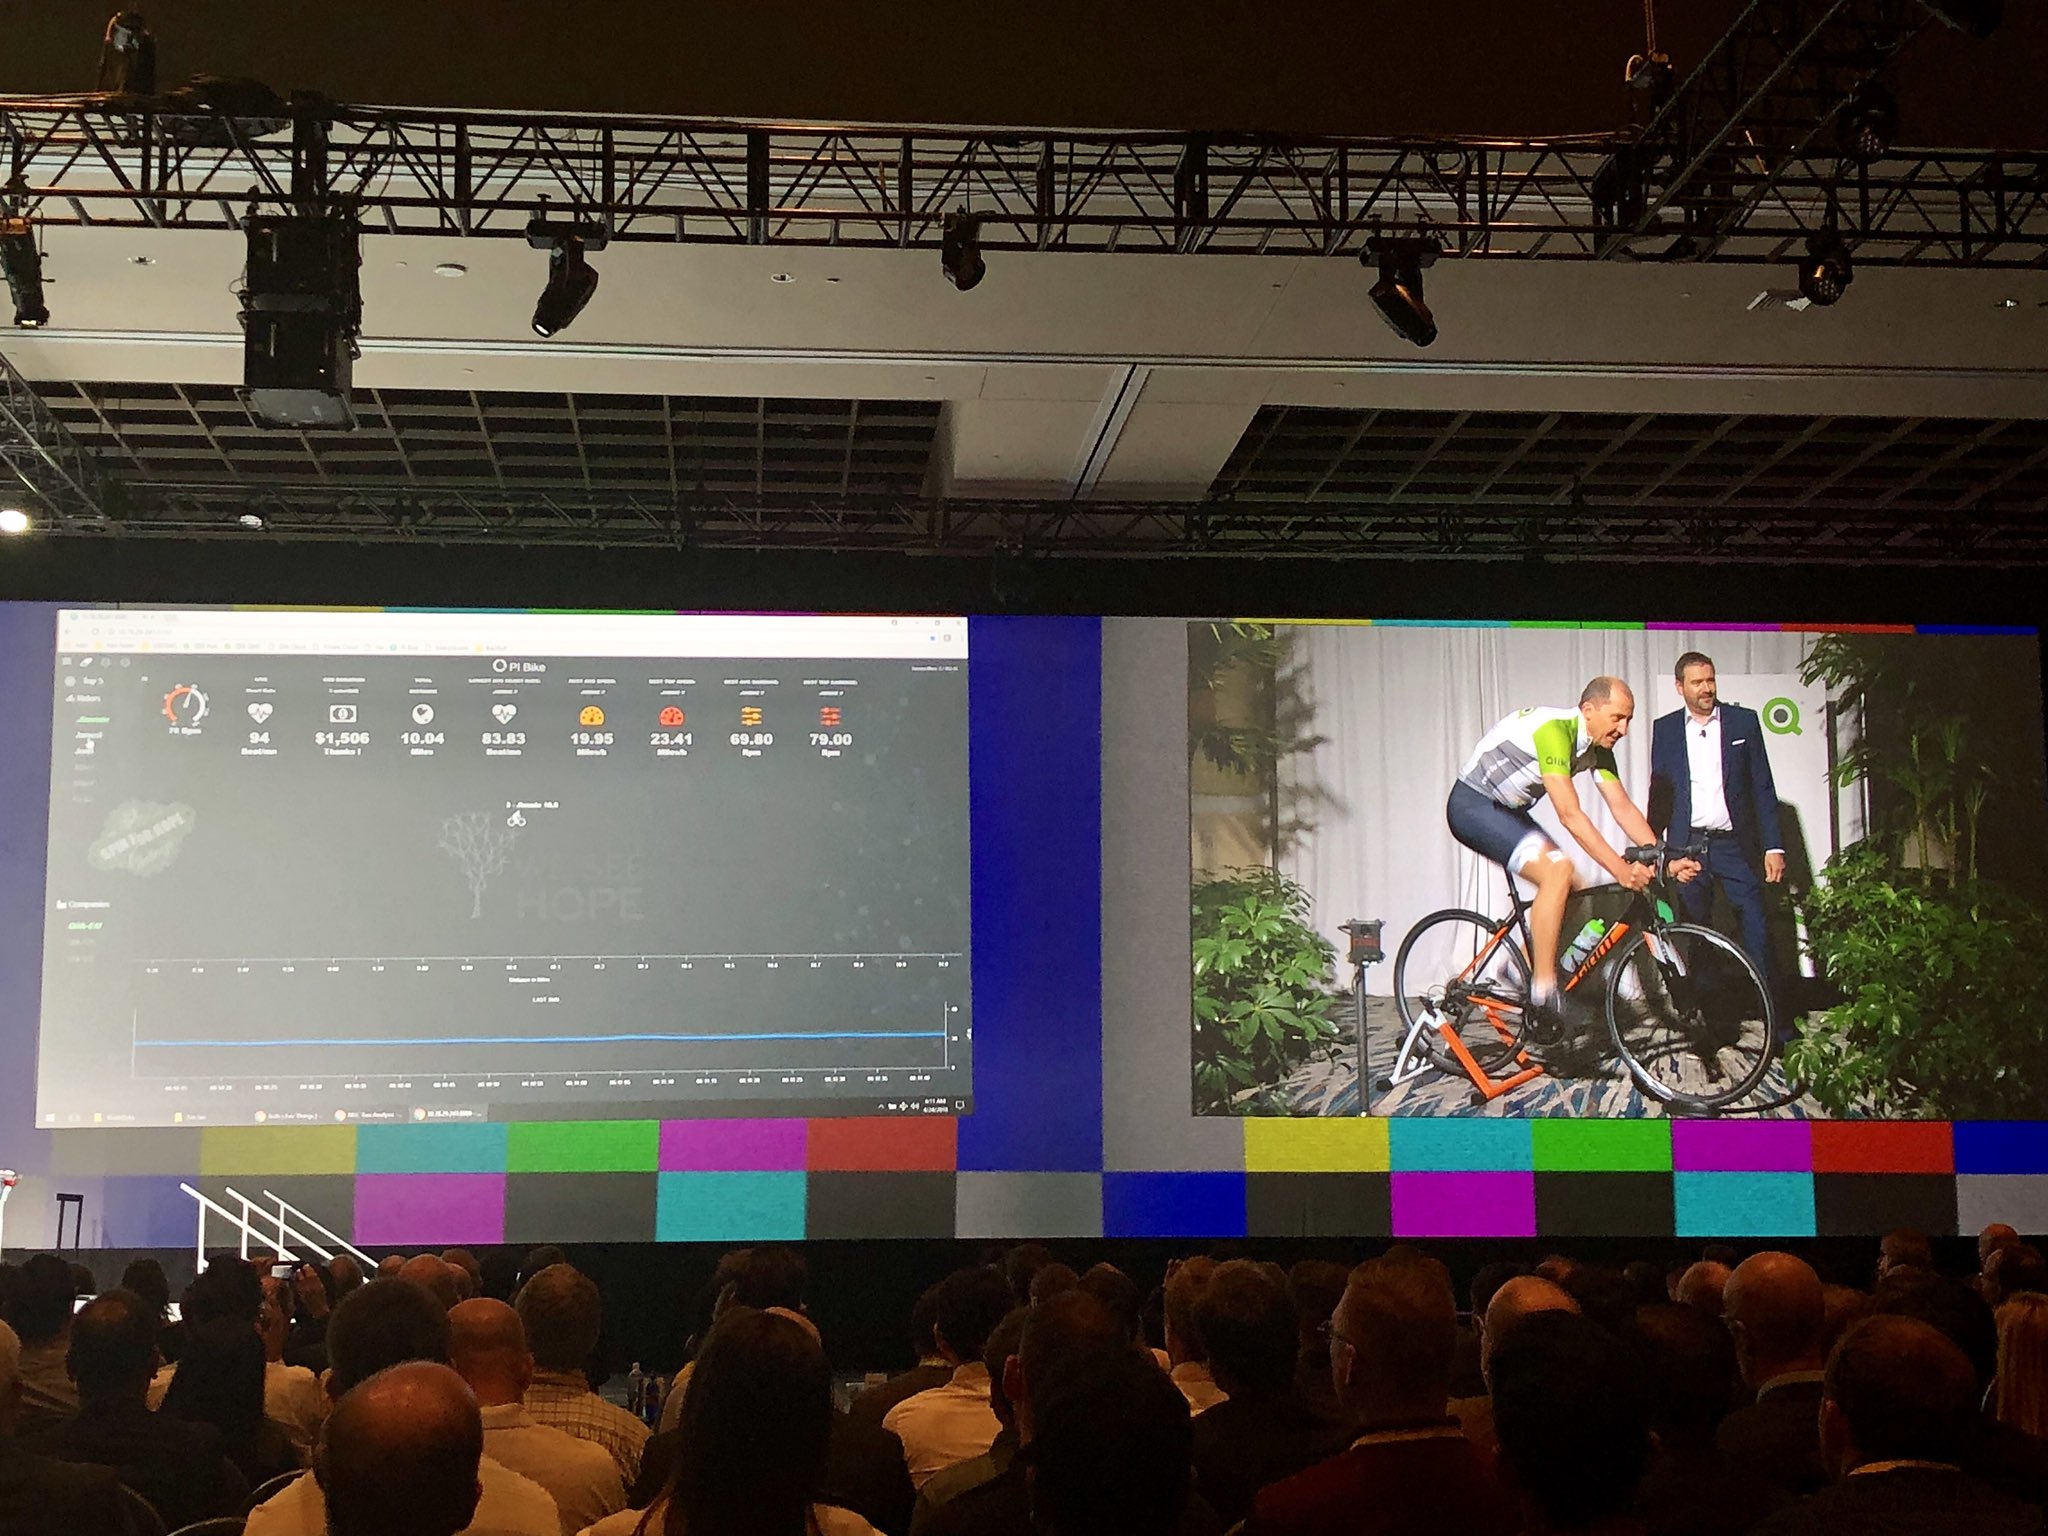
Hopefully you all attended Qonnections 2018 and saw Jimmie on the bike !!!

twitter4.jpg


Bike.qlik.com is the latest mashup build entirely with Qlik's open source libraries, Qlik Core, Enigma.js, Picasso.js,Leonardo UI and the Demo Team's Qdt-components.
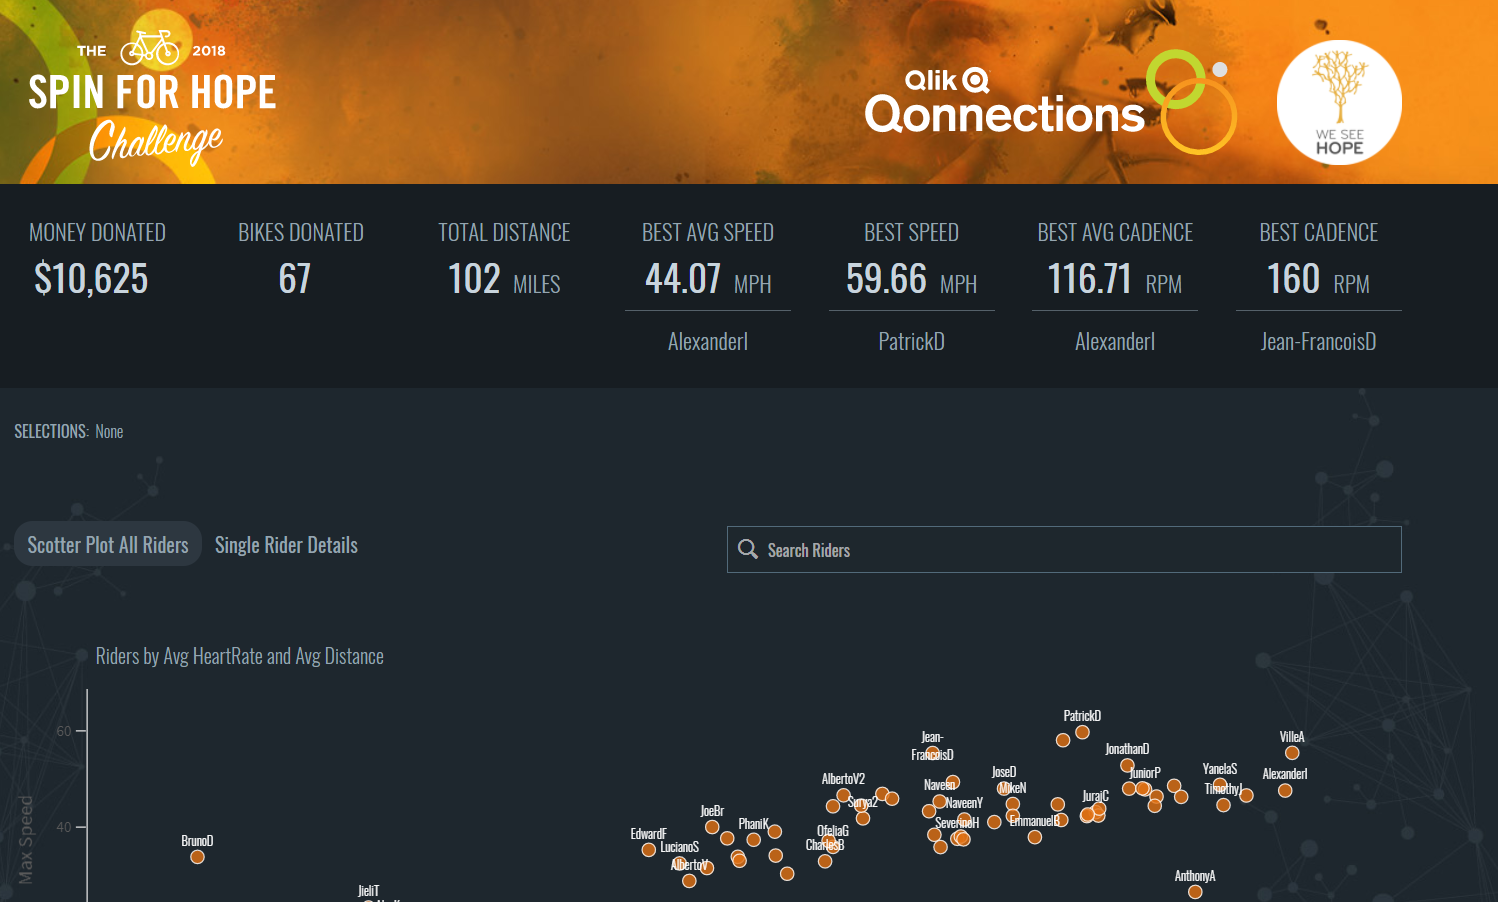
bike.qlik.com.png


Here is briefly how we did it

  • Sensors are sending data wireless to the Raspberry Pi
  • Node.js reads and writes csv
  • Qlik Core in Raspberry Pi is reading csv with a reload script and saves the data
  • Enigma.js connects and gets the data from Qlik Core then, Picasso.js is displaying that data in a graphical format
  • Node.js is uploading the qvds on Bike.qlik.com
  • Bike.qlik.com is a Docker that runs 2 containers in an AWS EC2 instance. One for the Qlik Core / Engine and another for an apache server
  • The htdocs and the Apps for the Qlik Core, are mounted outside of the 2 containers so there is no need to reload containers or recreate the Docker images, once the html code is changed or the qvf
  • Once uploaded, a Node.js restful api endpoint is reloading the session app, reads the new data from the just uploaded qvds and saves the qvf with the new data
  • React.js with Qdt-components is connecting to Qlik Core on the server and is getting the data
  • Qdt-components is rendering 11 KPI components and one search component (Leonardo UI) on the Rider field
  • Picasso.js is used to read the data and display a scatter plot and a line chart with tooltip and multiple selections


Expect more examples in the coming future with these combinations of our Open Source Software!!!!!


Yianni

8 Comments
gmanoharan
Contributor II
Contributor II

Hello Yianni,


Nice share and really helpful for exploring more.


Trying to read data using Enigma js from qvf and render the data in charts using picasso js as you did it in the bikers example  .

Could you please through some light on below queries on visualization rendering ?

  1. Used picasso js to render visualization  (Simple Bar chart with one Dim & Measure) using hypercube created by enigma  . Below is our understanding ,

Image.JPG

  • Is that always the above flow to be created for each and every chart creation ? Ex : I’ve 2 bar charts to be created with different multy dimensions / measures. Do I need to create separately or is there a way to reuse the definition of the chart ?
  • Are there any different hypercube definitions for different visualizations (Line, Bar , scatter …) ?
  • What is the advantage of using Picasso q plug-in ?


2.Where does the QDT –Components fits in the above flow ? What is the advantage of using the components ?

    • Our understanding is that qtd-components requires qlik.js to render visualization. But, per the below comments from you , refers QDT component doesn’t qlik.js.

https://community.qlik.com/blogs/qlikviewdesignblog/2018/04/24/introducing-qdt-theme#comment-67500

Can we use qlik.js as a open source component with QDT ?

  • Is there any reference how to render charts with Picasso & QDT components ?

Kindly share any references for any of the topics above .

0 Likes
3,830 Views
Yianni_Ververis
Employee
Employee

Hello gmanoharan‌.

You have set many questions and I will try to answer all

  • That is the flow and you can have as many calls with the same definition
  • No, it's only one HyperCube which you can use in as many picasso settings, https://github.com/qlik-demo-team/qdt-components/tree/master/src/picasso/settings,
  • Q plugin has a better handle on selections and especially when you render canvas and drag and select multiple dimensions/measures, https://webapps.qlik.com/qdt-components/react/index.html#/picasso-horizontal-barchart
  • Qdt-components is a pre-set library with some picasso settings. The advantage is that you can use it with every framework, like React, Angular 6, Vue etc. It takes care of the connection and the rendering
  • Qlik.js is only called if you set in the config the VizApi to true and you want to embed object from a Qvf
  • Qdt-theme is not connected to Qdt-components, at least not yet
  • What do you mean "Can we use qlik.js as a open source component with QDT ?".

Best,

Yianni

0 Likes
3,830 Views
Anonymous
Not applicable

Hello

Great post! I am sure will be very helpful for the community.

I have a question about, How can we load data from qvds using Qlik Core?

Could you give me more information?

Thanks in advance.


Best regards

0 Likes
3,830 Views
Yianni_Ververis
Employee
Employee

I would have the qvf read qvds, then an endpoint in your rest api server that reloads and saves the app

0 Likes
3,830 Views
Anonymous
Not applicable

Thanks so much. I will try it!

0 Likes
3,830 Views
alan_grn
Creator II
Creator II

This is great. Is the source code available? Is there any plan to make it available?

It would be a good starter guide.

0 Likes
3,830 Views
alan_grn
Creator II
Creator II

Will all components of qdt-compoents work with Qlik-Core? For example does Qlik Core have a Current Selections Toolbar?

0 Likes
3,081 Views
dgreenberg
Luminary Alumni
Luminary Alumni

Do you have any information on the sensors used to capture bike data?

0 Likes
2,073 Views