Unlock a world of possibilities! Login now and discover the exclusive benefits awaiting you.
- Qlik Community
- :
- Discover
- :
- Blogs
- :
- Product
- :
- Design
- :
- Unbalanced, n-level hierarchies
- Subscribe to RSS Feed
- Mark as New
- Mark as Read
- Bookmark
- Subscribe
- Printer Friendly Page
- Report Inappropriate Content
Hierarchies are very common in all database and business intelligence solutions. Usually they are balanced and with a fix number of levels, and then they do not pose any problems. Just load the data, add a drill-down group, and you’re done.

But there is one type of hierarchy that is somewhat tricky to get right – an unbalanced, n-level hierarchy. Typical for this type of hierarchy is that the levels are not named, and you really don’t know on which level you need to search for a specific node.
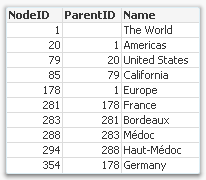
Usually such a hierarchy is stored in an Adjacent Nodes table, i.e. a table that has one record per node and each node has a reference to its parent.
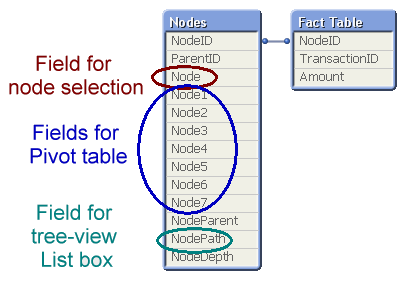
Such a table can be loaded into QlikView directly using the Hierarchy prefix. This prefix will transform the Adjacent Nodes table into an Expanded Nodes table that has additional fields that you can use in your app.

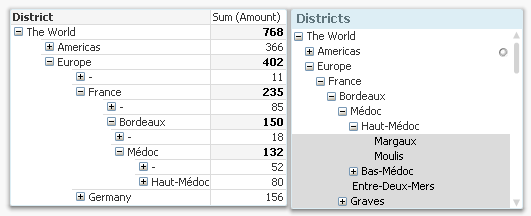
With the fields in this table, you can easily create a pivot table and a tree-view list box. Below you can see some wine districts displayed in both these object types:

One challenge with hierarchies is that you can refer to a node in two different ways: Either to the node including the entire sub-tree, or to the node only, excluding all sub-nodes. In the example with the wine districts, it would mean any wine from Bordeaux, and unspecified Bordeaux, respectively. In the pivot table above, the difference is obvious: Any wine from Bordeaux sums up to 150 units, and the unspecified Bordeaux sums up to 18 units.
A user usually wants to make selections referring to the entire sub-tree, but the above solution does not have any field for this. To create such a field, you need the second hierarchy-resolving prefix – the HierarchyBelongsTo.
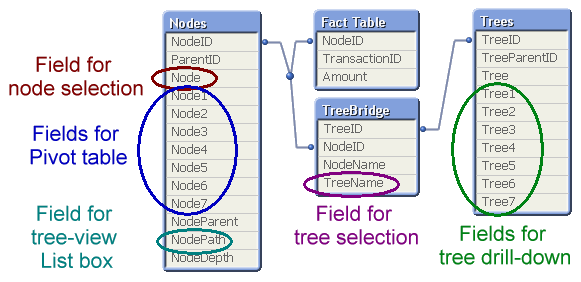
This prefix will also transform the hierarchy table. The result will be a table containing one record per descendant-ancestor pair. In other words, the ancestor (tree ID) will link to all its descendants (node ID), and can thus be used to make selections of entire sub-trees. (The “TreeBridge” table in the picture below.)
But it doesn’t stop here… The above solution creates one field in which tree searches can be made, but in order to create a drill-down for trees, you need an additional table – an expanded nodes table for the trees. This can be created with a second Hierarchy statement, but now one that links to the tree ID instead of the node ID. (The “Trees” table in the picture below.)

The data model with the three hierarchy tables is the one I recommend: It generates all fields you need.
A more elaborate explanation with script examples can be found in the technical brief about Hierarchies.
Further reading related to this topic:
- « Previous
- Next »
You must be a registered user to add a comment. If you've already registered, sign in. Otherwise, register and sign in.