Unlock a world of possibilities! Login now and discover the exclusive benefits awaiting you.
- Qlik Community
- :
- All Forums
- :
- Visualization and Usability
- :
- Re: how to restrict dimension best practice?
- Subscribe to RSS Feed
- Mark Topic as New
- Mark Topic as Read
- Float this Topic for Current User
- Bookmark
- Subscribe
- Mute
- Printer Friendly Page
- Mark as New
- Bookmark
- Subscribe
- Mute
- Subscribe to RSS Feed
- Permalink
- Report Inappropriate Content
how to restrict dimension best practice?
good day!
I've got 3 mln rows in fact table and 200 rows in dimension table "balance_dim" linking by sort of account field
I want to make a sheet in my app dedicated to "loans" from whole "balance_dim"
"loans" are only 80 rows from 200 rows of "balance_dim", and I do not want users see unneeded rows in filter
Is it normal to make one more dimension "loans_dim" with 80 rows in it and use it, and how about 4-5 dimensions like this, e.g. "deposits_dim" or "P&L_dim"
Please, help me!
In MS PowerPivot I can make disconnected table, and use it as a slicer, directly coding how table/chart should respond when user clicks something in a slicer
thank you!
Accepted Solutions
- Mark as New
- Bookmark
- Subscribe
- Mute
- Subscribe to RSS Feed
- Permalink
- Report Inappropriate Content
If you want to have Filter Panels with limited lists of the Dimension values, without creating separate fields in the script, you could use Advanced Aggregation and Set Analysis. Something like this:
=aggr(
only( {$<Type={Loans}>} Account )
, Account)
This will filter out only the Accounts that are Loans.
To Michael's point, the performance might be better if you created extra fields. You can try it both ways and decide for yourself.
cheers,
Oleg Troyansky
www.masterssummit.com - take your QlikView skills to the next level!
- Mark as New
- Bookmark
- Subscribe
- Mute
- Subscribe to RSS Feed
- Permalink
- Report Inappropriate Content
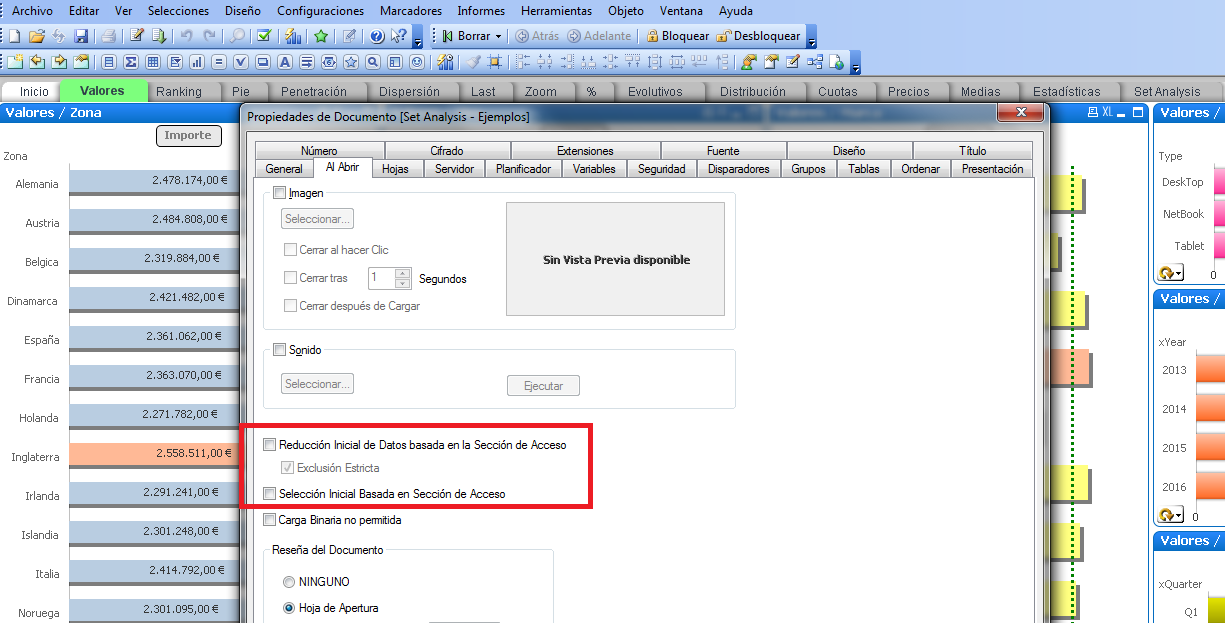
You can reduce the data thought option in document conf.

- Mark as New
- Bookmark
- Subscribe
- Mute
- Subscribe to RSS Feed
- Permalink
- Report Inappropriate Content
thank you
but it is not the Qlik Sense
- Mark as New
- Bookmark
- Subscribe
- Mute
- Subscribe to RSS Feed
- Permalink
- Report Inappropriate Content
I',m sorry
- Mark as New
- Bookmark
- Subscribe
- Mute
- Subscribe to RSS Feed
- Permalink
- Report Inappropriate Content
Yes, it is normal to create additional "restricted" dimensions in the script. An alternative is to use calculated dimensions, but from the performance point it's better to have actual fields.
- Mark as New
- Bookmark
- Subscribe
- Mute
- Subscribe to RSS Feed
- Permalink
- Report Inappropriate Content
Hi,
To remove values that are not having any transaction row we can use the Left Keep() like below
loans:
LOAD
*
FROM loans;
LEFT Keep(loans)
LOAD
*
FROM balance_dim;
Hope this helps you.
Regards,
Jagan.
- Mark as New
- Bookmark
- Subscribe
- Mute
- Subscribe to RSS Feed
- Permalink
- Report Inappropriate Content
thank you!
- Mark as New
- Bookmark
- Subscribe
- Mute
- Subscribe to RSS Feed
- Permalink
- Report Inappropriate Content
thank you!
what do you think:
1. 5-6 additional "restricted" dimensions in the script
2. 5-6 additional fields in "balance_dim", like "loans" or "deposits" and so on
and if I've got 300 rows in "balance_dim" then in the field "loans" would be 80 rows with flag and 220 rows with Null
when I would work with a dedicated list "loans" in my app my measures, like Sum may be like
aggr ... loans_flag
please!
- Mark as New
- Bookmark
- Subscribe
- Mute
- Subscribe to RSS Feed
- Permalink
- Report Inappropriate Content
If you want to have Filter Panels with limited lists of the Dimension values, without creating separate fields in the script, you could use Advanced Aggregation and Set Analysis. Something like this:
=aggr(
only( {$<Type={Loans}>} Account )
, Account)
This will filter out only the Accounts that are Loans.
To Michael's point, the performance might be better if you created extra fields. You can try it both ways and decide for yourself.
cheers,
Oleg Troyansky
www.masterssummit.com - take your QlikView skills to the next level!
- Mark as New
- Bookmark
- Subscribe
- Mute
- Subscribe to RSS Feed
- Permalink
- Report Inappropriate Content
This is correct. working fine
thanks