Unlock a world of possibilities! Login now and discover the exclusive benefits awaiting you.
- Qlik Community
- :
- Discover
- :
- Programs
- :
- Education
- :
- Qlik Education Discussions
- :
- How to create a pivot table with independent dimen...
- Subscribe to RSS Feed
- Mark Topic as New
- Mark Topic as Read
- Float this Topic for Current User
- Bookmark
- Subscribe
- Mute
- Printer Friendly Page
- Mark as New
- Bookmark
- Subscribe
- Mute
- Subscribe to RSS Feed
- Permalink
- Report Inappropriate Content
How to create a pivot table with independent dimensions.
I have Requirement that showing actual,previous,target values by product wise (showing in one row in top of the table ). And also I need to show these for dimensions (all are independent) ex: Sales,Market share,growth % like this... i.e i need sales for actual,previous,growth values by product wise.. Can Anyone help this..
Thanks in advance.
Accepted Solutions
- Mark as New
- Bookmark
- Subscribe
- Mute
- Subscribe to RSS Feed
- Permalink
- Report Inappropriate Content
Yeah i got the solution for above Problem by using ValueList we can create a temporary dimension having custom metrics.
I think the below link is helpfull
http://community.qlik.com/thread/49885
Thank you.
- Mark as New
- Bookmark
- Subscribe
- Mute
- Subscribe to RSS Feed
- Permalink
- Report Inappropriate Content
I'm having trouble visualizing this. Can you provide a sample of what you need?
- Mark as New
- Bookmark
- Subscribe
- Mute
- Subscribe to RSS Feed
- Permalink
- Report Inappropriate Content
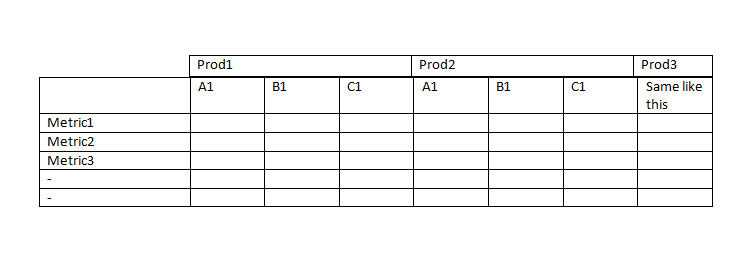
Thank you for your response. I want to show a pivot table like this..
showing A1,B1,C1 values ex: actual,previous,target values by all products showing prod name top (by using scrollbar) for Metrics ex: sales,growth,share like dimensions. I cant do it by using different tables for each metric because i have many products to show by using scrollbar. If I scroll one table other wont scroll so It is not possible by dng this.
All are independent one having different expressions.
Pls help me to solve this problem..
- Mark as New
- Bookmark
- Subscribe
- Mute
- Subscribe to RSS Feed
- Permalink
- Report Inappropriate Content
Yeah i got the solution for above Problem by using ValueList we can create a temporary dimension having custom metrics.
I think the below link is helpfull
http://community.qlik.com/thread/49885
Thank you.