Unlock a world of possibilities! Login now and discover the exclusive benefits awaiting you.
Announcements
April 13–15 - Dare to Unleash a New Professional You at Qlik Connect 2026: Register Now!
- Qlik Community
- :
- All Forums
- :
- QlikView App Dev
- :
- Bar chart solution please
Options
- Subscribe to RSS Feed
- Mark Topic as New
- Mark Topic as Read
- Float this Topic for Current User
- Bookmark
- Subscribe
- Mute
- Printer Friendly Page
Turn on suggestions
Auto-suggest helps you quickly narrow down your search results by suggesting possible matches as you type.
Showing results for
Not applicable
2016-03-20
10:20 PM
- Mark as New
- Bookmark
- Subscribe
- Mute
- Subscribe to RSS Feed
- Permalink
- Report Inappropriate Content
Bar chart solution please
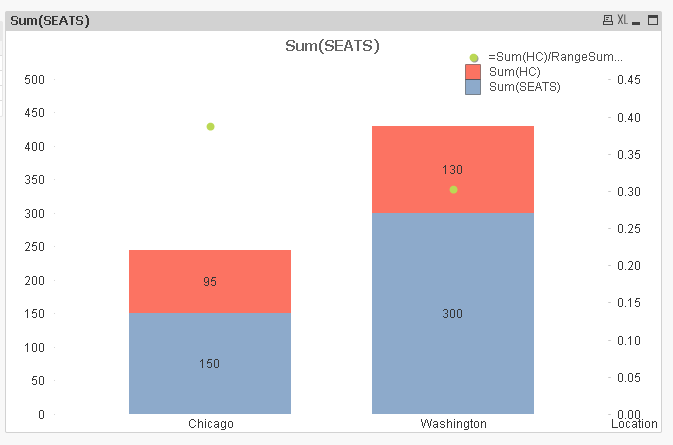
| Location | UNIT | SEATS | HC | VAC |
| Chicago | Warehouse | 100 | 70 | 30% |
| Chicago | Shop | 50 | 25 | 50% |
| Washington | Mall | 200 | 80 | 20% |
| Washington | Corporate | 100 | 50 | 50% |
I need Stackable bar chart by Unit by Location ( Ex : at location Chicago there are 150 seats,95 hc and 37% vacancy)
Each stack in a bar should show total of seats and HC and a bubble or check box to show Vacancy%.Pimary x- axis value should show Seats and Empty Seats and secondary x-axis value should show vacancy %.Not sure if this is possible.
Thanks,
Alva.
1,069 Views
1 Solution
Accepted Solutions
MVP
2016-03-20
10:29 PM
- Mark as New
- Bookmark
- Subscribe
- Mute
- Subscribe to RSS Feed
- Permalink
- Report Inappropriate Content
975 Views
6 Replies
MVP
2016-03-20
10:29 PM
- Mark as New
- Bookmark
- Subscribe
- Mute
- Subscribe to RSS Feed
- Permalink
- Report Inappropriate Content
This?
976 Views
MVP
2016-03-20
10:36 PM
- Mark as New
- Bookmark
- Subscribe
- Mute
- Subscribe to RSS Feed
- Permalink
- Report Inappropriate Content
How are you getting a vacancy of 37% at Chicago location?
975 Views
Master III
2016-03-20
10:37 PM
- Mark as New
- Bookmark
- Subscribe
- Mute
- Subscribe to RSS Feed
- Permalink
- Report Inappropriate Content
Hi Sunny,
I think it should be (3rd exp)
=1-Sum(HC)/Sum(SEATS)
Number format (%)
- but not sure, this is what he needs..
MVP
2016-03-20
10:40 PM
- Mark as New
- Bookmark
- Subscribe
- Mute
- Subscribe to RSS Feed
- Permalink
- Report Inappropriate Content
Makes sense 
975 Views
Not applicable
2016-03-20
10:58 PM
Author
- Mark as New
- Bookmark
- Subscribe
- Mute
- Subscribe to RSS Feed
- Permalink
- Report Inappropriate Content
Thank you.I think this is almost what they need.Thank you very much.
975 Views
MVP
2016-03-20
11:00 PM
- Mark as New
- Bookmark
- Subscribe
- Mute
- Subscribe to RSS Feed
- Permalink
- Report Inappropriate Content
Awesome
975 Views