Unlock a world of possibilities! Login now and discover the exclusive benefits awaiting you.
- Qlik Community
- :
- All Forums
- :
- QlikView App Dev
- :
- Re: Bar chart
- Subscribe to RSS Feed
- Mark Topic as New
- Mark Topic as Read
- Float this Topic for Current User
- Bookmark
- Subscribe
- Mute
- Printer Friendly Page
- Mark as New
- Bookmark
- Subscribe
- Mute
- Subscribe to RSS Feed
- Permalink
- Report Inappropriate Content
Bar chart
Hi,
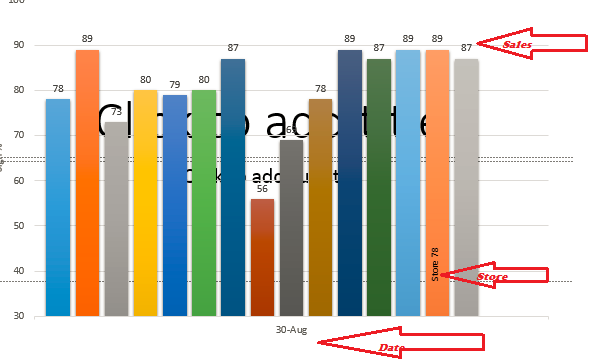
We are having store(12,15,17,..),date and measure as sum(sales).I need to show this detail in bar chart as below image.
Thanks..
- « Previous Replies
-
- 1
- 2
- Next Replies »
- Mark as New
- Bookmark
- Subscribe
- Mute
- Subscribe to RSS Feed
- Permalink
- Report Inappropriate Content
Like this ??
- Mark as New
- Bookmark
- Subscribe
- Mute
- Subscribe to RSS Feed
- Permalink
- Report Inappropriate Content
PFA qvw file
- Mark as New
- Bookmark
- Subscribe
- Mute
- Subscribe to RSS Feed
- Permalink
- Report Inappropriate Content
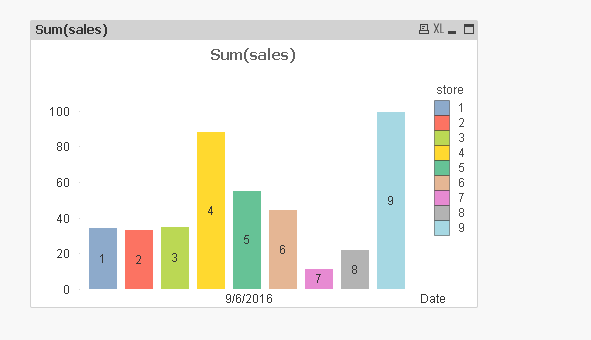
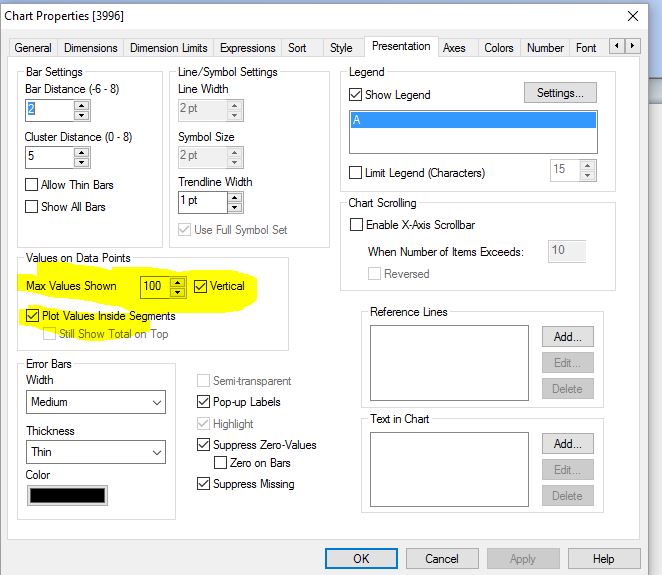
For plotting text inside the bars you can use the dual(text, number) function. It will take the text value for labels and the number for the height of the bars.
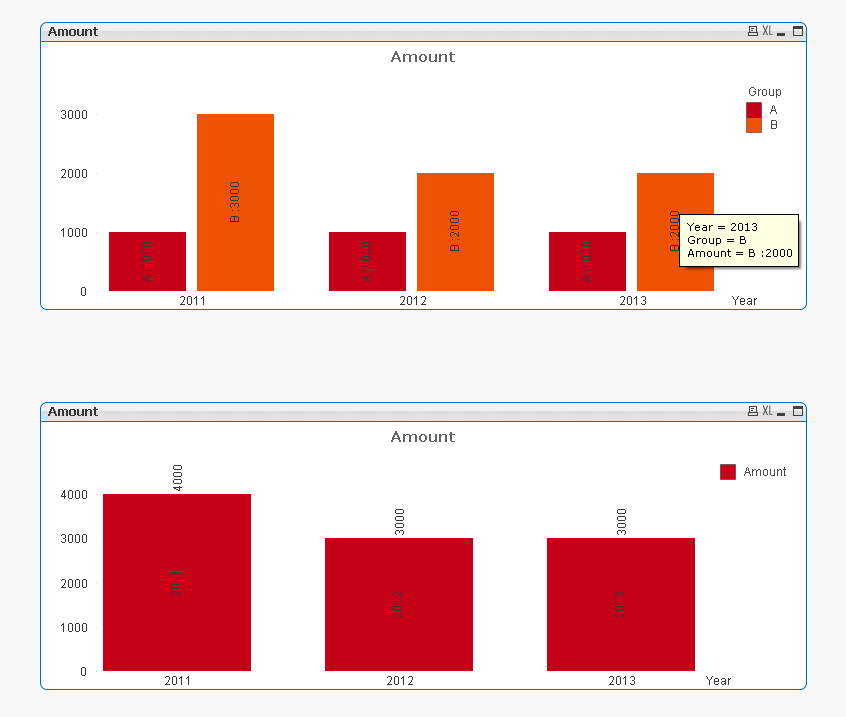
For the display of text AND values above the bar, you can maybe use a combo chart with a (invisible) line for the values above the bars. This will only work with a single dimension and both text and value in vertical presentation.
For more than one dimension you will have to display both text and value inside the bar.
Alternatively overlay two bar charts to meet all your needs...
- Mark as New
- Bookmark
- Subscribe
- Mute
- Subscribe to RSS Feed
- Permalink
- Report Inappropriate Content
Qvw attached
- Mark as New
- Bookmark
- Subscribe
- Mute
- Subscribe to RSS Feed
- Permalink
- Report Inappropriate Content
You can also follow this below process:
Susovan
- Mark as New
- Bookmark
- Subscribe
- Mute
- Subscribe to RSS Feed
- Permalink
- Report Inappropriate Content
Simply take
Date and Store as dimension in Bar
Sum(Sales) as Expression
Any issue?
- Mark as New
- Bookmark
- Subscribe
- Mute
- Subscribe to RSS Feed
- Permalink
- Report Inappropriate Content
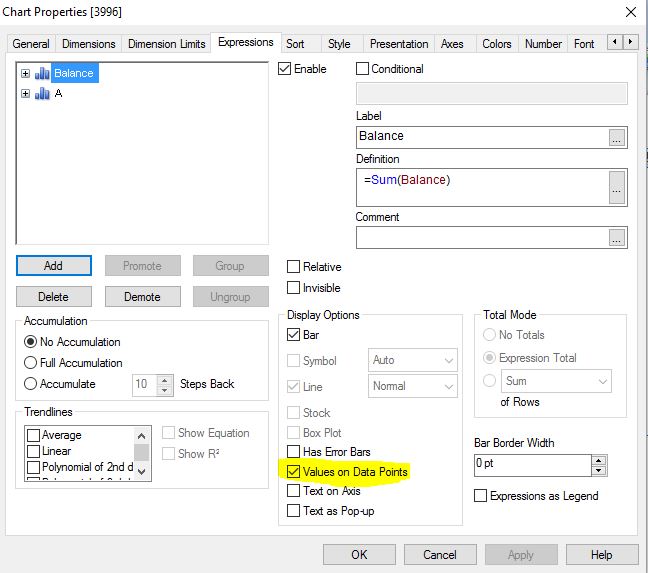
You can take store in expression and check the "Plot Values inside Segments" option in Presentation tab.
- Mark as New
- Bookmark
- Subscribe
- Mute
- Subscribe to RSS Feed
- Permalink
- Report Inappropriate Content
Hi,
Can i get multi color chart.
Thanks..
- Mark as New
- Bookmark
- Subscribe
- Mute
- Subscribe to RSS Feed
- Permalink
- Report Inappropriate Content
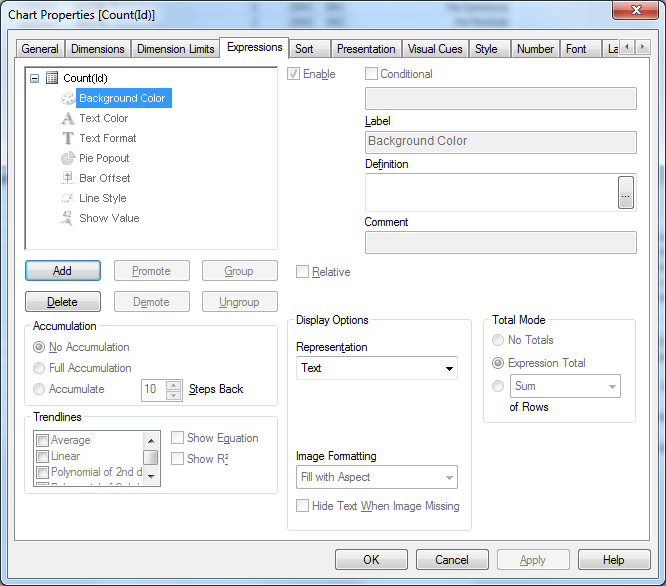
Click on the +sign in front of the bar amount expression (in my example) and put in the background color expression
=Color(Rowno())
where to find:
- « Previous Replies
-
- 1
- 2
- Next Replies »