Unlock a world of possibilities! Login now and discover the exclusive benefits awaiting you.
- Qlik Community
- :
- All Forums
- :
- QlikView App Dev
- :
- Comparing records
- Subscribe to RSS Feed
- Mark Topic as New
- Mark Topic as Read
- Float this Topic for Current User
- Bookmark
- Subscribe
- Mute
- Printer Friendly Page
- Mark as New
- Bookmark
- Subscribe
- Mute
- Subscribe to RSS Feed
- Permalink
- Report Inappropriate Content
Comparing records
Hi All,
I have a requirement where I want to count the number of items that are newly added . I need to compare the items with that of previous Month.
| Month -Year | ItemName | ItemNo |
| Jan-15 | AAA | 1 |
| Jan-15 | BBB | 2 |
| Jan-15 | CCC | 3 |
| Feb-15 | AAA | 1 |
| Feb-15 | BBB | 2 |
| Feb-15 | DDD | 4 |
| Mar-15 | BBB | 2 |
| Mar-15 | DDD | 4 |
| Mar-15 | EEE | 5 |
| Mar-15 | CCC | 3 |
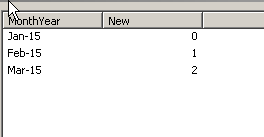
I want to show in straight table as below
| Month-Year | NewlyAddedItems |
| Jan-15 | 0 |
| Feb-15 | 1 |
| Mar-15 | 2 |
Help on this ..
Thanks
- Mark as New
- Bookmark
- Subscribe
- Mute
- Subscribe to RSS Feed
- Permalink
- Report Inappropriate Content
source:
load *, date(date#(MonthYear, 'MMM-YY')) as Date inline [
MonthYear ItemName ItemNo
Jan-15 AAA 1
Jan-15 BBB 2
Jan-15 CCC 3
Feb-15 AAA 1
Feb-15 BBB 2
Feb-15 DDD 4
Mar-15 BBB 2
Mar-15 DDD 4
Mar-15 EEE 5
Mar-15 CCC 3
] (delimiter is spaces);
load Date(min(Date)) as MinDate Resident source;
let vMinDate=Peek('MinDate');
Left Join (source)
load
ItemName, ItemNo, Date,
if( Peek('ItemNo')=ItemNo and Peek('Date')=AddMonths(Date, -1) or Date='$(vMinDate)' , 'Exists', 'New') as FlagExists
Resident source
Order by ItemNo, Date;
Final:
load MonthYear, sum(if(FlagExists='New',1,0)) as New
Resident source
group by MonthYear;
- Mark as New
- Bookmark
- Subscribe
- Mute
- Subscribe to RSS Feed
- Permalink
- Report Inappropriate Content
Hi MG,
Thanks for the solution but I need to do this in Chart level without changing in the script. How this could be done in chart?
Thanks