Unlock a world of possibilities! Login now and discover the exclusive benefits awaiting you.
- Qlik Community
- :
- All Forums
- :
- QlikView App Dev
- :
- Converting Year-to-Date Pivot Chart into Line Char...
- Subscribe to RSS Feed
- Mark Topic as New
- Mark Topic as Read
- Float this Topic for Current User
- Bookmark
- Subscribe
- Mute
- Printer Friendly Page
- Mark as New
- Bookmark
- Subscribe
- Mute
- Subscribe to RSS Feed
- Permalink
- Report Inappropriate Content
Converting Year-to-Date Pivot Chart into Line Chart
Hi all! 
I have been struggling for quite a while with this. I hope someone can help me out.
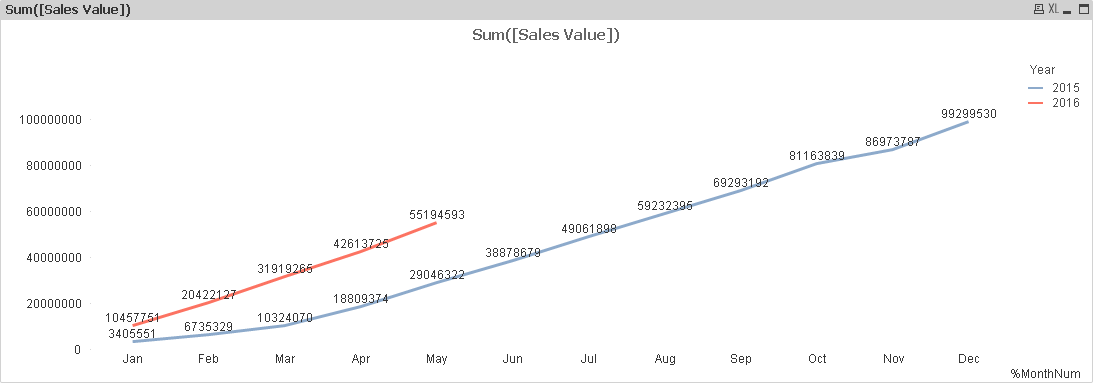
What I would like to achieve is to show Year-to-Date data in a chart. I have calculated the YTD data seen in the following image, by using the following expression (%MonthNum is 1-12 for Jan-Dec):
RangeSum(Before(Sum({come condition}[Sales Value]), 0, %MonthNum))
This is a modified pivot chart!

I would like to represent this data in a line chart. Two separate line graphs in one chart for 2015 and 2016. I have tried variations on Above/Before, changing the order of importance of the dimensions "Month" and "Year", etc.
Any help would be greatly appreciated!
Accepted Solutions
- Mark as New
- Bookmark
- Subscribe
- Mute
- Subscribe to RSS Feed
- Permalink
- Report Inappropriate Content
Something like this?
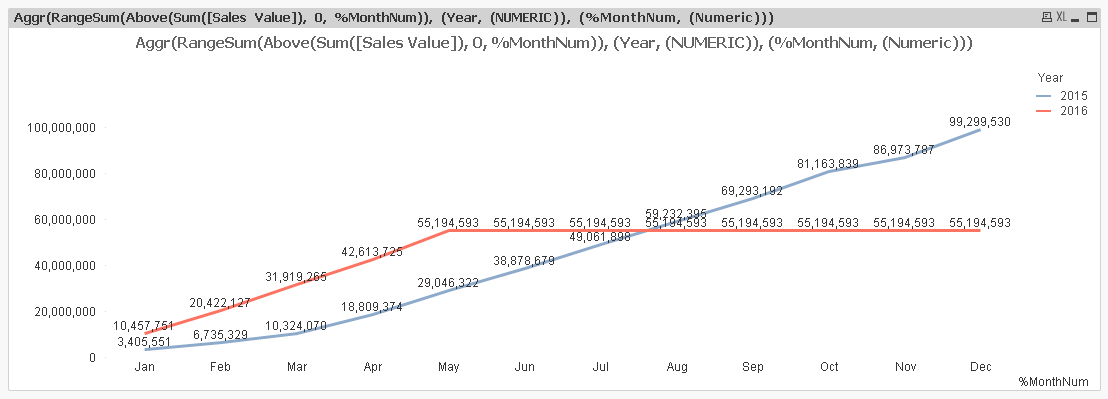
Expression used:
Aggr(RangeSum(Above(Sum([Sales Value]), 0, %MonthNum)), (Year, (NUMERIC)), (%MonthNum, (Numeric)))
But this will work only in QV12 or above and Qlik Sense
- Mark as New
- Bookmark
- Subscribe
- Mute
- Subscribe to RSS Feed
- Permalink
- Report Inappropriate Content
Can you post sample data?
If a post helps to resolve your issue, please accept it as a Solution.
- Mark as New
- Bookmark
- Subscribe
- Mute
- Subscribe to RSS Feed
- Permalink
- Report Inappropriate Content
Do you happen to have QV12? If you do, you might be able to make this work using sorting available within the Aggr() function (The sortable Aggr function is finally here!). If you don't, then you will have to rely on sorting in the script.
- Mark as New
- Bookmark
- Subscribe
- Mute
- Subscribe to RSS Feed
- Permalink
- Report Inappropriate Content
Find attached a simple .csv file with sales values. Please let me know if it is sufficient.
- Mark as New
- Bookmark
- Subscribe
- Mute
- Subscribe to RSS Feed
- Permalink
- Report Inappropriate Content
Hi! I do indeed have QlikView 12.
- Mark as New
- Bookmark
- Subscribe
- Mute
- Subscribe to RSS Feed
- Permalink
- Report Inappropriate Content
Something like this?
Expression used:
Aggr(RangeSum(Above(Sum([Sales Value]), 0, %MonthNum)), (Year, (NUMERIC)), (%MonthNum, (Numeric)))
But this will work only in QV12 or above and Qlik Sense
- Mark as New
- Bookmark
- Subscribe
- Mute
- Subscribe to RSS Feed
- Permalink
- Report Inappropriate Content
That looks great! Its exactly what I need. I'll have a look at the link you sent to understand more about the sortable Aggr function - looks like a very important tool. Thanks a lot for the quick response!
- Mark as New
- Bookmark
- Subscribe
- Mute
- Subscribe to RSS Feed
- Permalink
- Report Inappropriate Content
As this is in the chart we can control the sorting hence you can also make use of the in-built accumulation function to get the result

- Mark as New
- Bookmark
- Subscribe
- Mute
- Subscribe to RSS Feed
- Permalink
- Report Inappropriate Content
Good one, did not realize that we can simplify this. Thanks for sharing this
- Mark as New
- Bookmark
- Subscribe
- Mute
- Subscribe to RSS Feed
- Permalink
- Report Inappropriate Content
Thanks a lot! That is really simple. Appreciated.