Unlock a world of possibilities! Login now and discover the exclusive benefits awaiting you.
- Qlik Community
- :
- All Forums
- :
- QlikView App Dev
- :
- Data matrix
- Subscribe to RSS Feed
- Mark Topic as New
- Mark Topic as Read
- Float this Topic for Current User
- Bookmark
- Subscribe
- Mute
- Printer Friendly Page
- Mark as New
- Bookmark
- Subscribe
- Mute
- Subscribe to RSS Feed
- Permalink
- Report Inappropriate Content
Data matrix
Hi, I want to show field data in matrix layout, that is, if i have this values in a filed: A1,A2,A3,A4,A5,A6,A7,A8,A9, I want to see:
| A1 | A4 | A7 |
| A2 | A5 | A8 |
| A3 | A6 | A9 |
I get this associating fields row and column to each data, but if I apply a filter I get this result, for example:
| A1 | A4 | |
| A5 | A8 | |
| A3 | A9 |
when I want:
| A1 | A5 |
| A3 | A8 |
| A4 | A9 |
Any idea?
- Mark as New
- Bookmark
- Subscribe
- Mute
- Subscribe to RSS Feed
- Permalink
- Report Inappropriate Content
Not sure if understood you right. May be just changing the listbox presentation line :
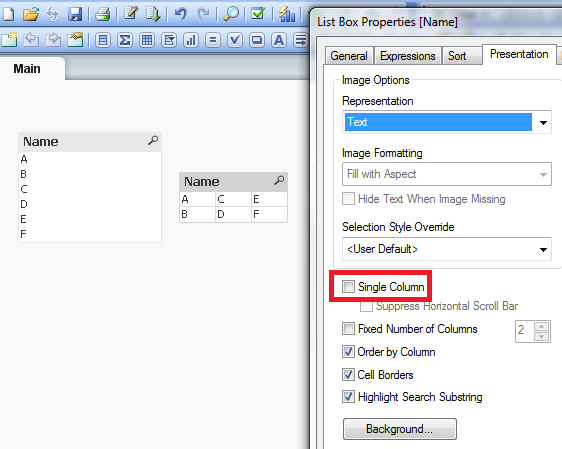
Uncheck the 'single column', and re-size the listbox by pulling the border up.
- Mark as New
- Bookmark
- Subscribe
- Mute
- Subscribe to RSS Feed
- Permalink
- Report Inappropriate Content
I thought about using a list box, but the field has repeated values and I want see all of them. I think I can't do this with a list box.
- Mark as New
- Bookmark
- Subscribe
- Mute
- Subscribe to RSS Feed
- Permalink
- Report Inappropriate Content
I guess if you could explain your real scenario requirement a bit more with a sample would help.
- Mark as New
- Bookmark
- Subscribe
- Mute
- Subscribe to RSS Feed
- Permalink
- Report Inappropriate Content
The real scenario is that I want to load weight data about items, and I want to show only this weights in a table, but 2 dimension table, not a column. I associated a row and column number to each weight and I with a pivot table, using this row and column as dimensions I get this, but if I filter, weights disappear on the table but it remains a gap: 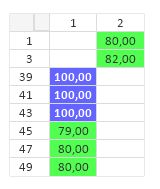
The weight in row 1 and column 1 disappear when I select a filter, but I need to reorder weights in only one column, so my approach doesn't work.
I need another approach to getting show all weights, if possible in tabular form, and responsive to the filters.
I appreciate any advice 
- Mark as New
- Bookmark
- Subscribe
- Mute
- Subscribe to RSS Feed
- Permalink
- Report Inappropriate Content
Tab:
May be like:
Load
Column1 as Weight,
Row
From <>;
Concatenate // this might not be required if you have all fields common in both table like here
Load
Column2 as Weight,
Row
From <>;