Unlock a world of possibilities! Login now and discover the exclusive benefits awaiting you.
Announcements
Qlik Open Lakehouse is Now Generally Available! Discover the key highlights and partner resources here.
- Qlik Community
- :
- All Forums
- :
- QlikView App Dev
- :
- Diplay max and min date in pivot when dimensions c...
Options
- Subscribe to RSS Feed
- Mark Topic as New
- Mark Topic as Read
- Float this Topic for Current User
- Bookmark
- Subscribe
- Mute
- Printer Friendly Page
Turn on suggestions
Auto-suggest helps you quickly narrow down your search results by suggesting possible matches as you type.
Showing results for
Creator
2013-05-20
07:00 AM
- Mark as New
- Bookmark
- Subscribe
- Mute
- Subscribe to RSS Feed
- Permalink
- Report Inappropriate Content
Diplay max and min date in pivot when dimensions change
Hi, I have a table like this
| CUSTOMER | DOC NR | SC1 | SC2 | DATE |
| CUSTOMER1 | 20 | 10% | 8% | 20/05/2013 |
| CUSTOMER1 | 19 | 10% | 8% | 19/05/2013 |
| CUSTOMER1 | 18 | 10% | 8% | 18/05/2013 |
| CUSTOMER1 | 17 | 15% | 11% | 16/05/2013 |
| CUSTOMER1 | 16 | 15% | 11% | 15/05/2013 |
| CUSTOMER1 | 15 | 15% | 11% | 14/05/2013 |
| CUSTOMER1 | 14 | 14% | 5% | 13/05/2013 |
| CUSTOMER1 | 13 | 14% | 5% | 12/05/2013 |
| CUSTOMER1 | 12 | 14% | 5% | 11/05/2013 |
| CUSTOMER1 | 11 | 14% | 5% | 10/05/2013 |
| CUSTOMER1 | 10 | 14% | 5% | 09/05/2013 |
| CUSTOMER1 | 9 | 10% | 8% | 07/05/2013 |
| CUSTOMER1 | 8 | 10% | 8% | 06/05/2013 |
| CUSTOMER1 | 7 | 22% | 8% | 05/05/2013 |
in which for every client I have the reference to the document issued by the relevant discounts and I need to create a pivot table like the following
| CUSTOMER | SC1 | SC2 | DATE START | DATE END |
| CUSTOMER1 | 10% | 8% | 18/05/2013 | 20/05/2013 |
| CUSTOMER1 | 17 | 15% | 14/05/2013 | 16/05/2013 |
| CUSTOMER1 | 10% | 8% | 06/05/2013 | 07/05/2013 |
but with a normal pivot I get the following result
| CUSTOMER | SC1 | SC2 | DATE START | DATE END |
| CUSTOMER1 | 10% | 8% | 18/05/2013 | 07/05/2013 |
| CUSTOMER1 | 17 | 15% | 14/05/2013 | 16/05/2013 |
can someone help me?
thanks
584 Views
4 Replies
Master II
2013-05-20
07:18 AM
- Mark as New
- Bookmark
- Subscribe
- Mute
- Subscribe to RSS Feed
- Permalink
- Report Inappropriate Content
Hi,
Please find the attached app.
HTH
sushil
Creator
2013-05-20
08:35 AM
Author
- Mark as New
- Bookmark
- Subscribe
- Mute
- Subscribe to RSS Feed
- Permalink
- Report Inappropriate Content
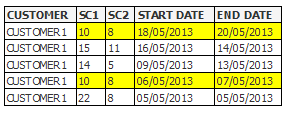
thanks, but I do not get what I need.
I need to have a pivot like this

in which I have two records for discounts sc1 sc2 highlighted
391 Views
Partner - Champion III
2013-05-20
01:44 PM
- Mark as New
- Bookmark
- Subscribe
- Mute
- Subscribe to RSS Feed
- Permalink
- Report Inappropriate Content
See attached qvw.
talk is cheap, supply exceeds demand
Creator
2013-05-21
01:53 AM
Author
- Mark as New
- Bookmark
- Subscribe
- Mute
- Subscribe to RSS Feed
- Permalink
- Report Inappropriate Content
thanks, this solution helps me. But can we have the same result by working only on the pivot table (not at the script level)? Thank you very much
391 Views