Unlock a world of possibilities! Login now and discover the exclusive benefits awaiting you.
- Qlik Community
- :
- All Forums
- :
- QlikView App Dev
- :
- Dynamic (Static) Step Dimension Axis
- Subscribe to RSS Feed
- Mark Topic as New
- Mark Topic as Read
- Float this Topic for Current User
- Bookmark
- Subscribe
- Mute
- Printer Friendly Page
- Mark as New
- Bookmark
- Subscribe
- Mute
- Subscribe to RSS Feed
- Permalink
- Report Inappropriate Content
Dynamic (Static) Step Dimension Axis
Hi Guys,
I have a question regarding presentation of values in a x dimension time.
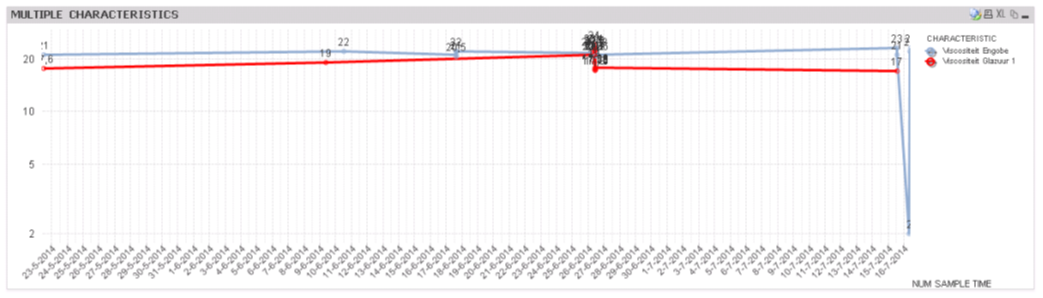
What I need is a line chart where measurements are plotted in time. But these values are not always consistent in time. Somethings there are days with more measurements then other days, like you can see in the attached graph. What I like to achieve is that the plotted values with more measurements (at the time, in minutes) are more visible in the graph. The scale should behave sort of dynamic to the interval of measurement. I think that the solution will be found in the Static Step option in combination with a function but I can't find it...
Anyone some idea's, examples or experience ?
Best regards,
Robert