Unlock a world of possibilities! Login now and discover the exclusive benefits awaiting you.
- Qlik Community
- :
- All Forums
- :
- QlikView App Dev
- :
- Help with expression, AGGR
- Subscribe to RSS Feed
- Mark Topic as New
- Mark Topic as Read
- Float this Topic for Current User
- Bookmark
- Subscribe
- Mute
- Printer Friendly Page
- Mark as New
- Bookmark
- Subscribe
- Mute
- Subscribe to RSS Feed
- Permalink
- Report Inappropriate Content
Help with expression, AGGR
Hi all,
i have the an expression in a chart in the attached QVW. the chart is by Group and Customer. The groups are..
CORE
XMAS
and a total.
I can't seem to get the xmas figures to show up. The user must have a Period and Year selected for the chart to populate, but i have some set analysis to overrule the selection, i have it to show all values <= selected Period.
The set analysis works as expected in other expressions so i don't think the issue lies there.
Is anyone able to take a look and advise?
basically, from the below chart (also in the QVW) you can see that there are CORE sales for each period, and XMAS sales for periods 5,6,7,8.
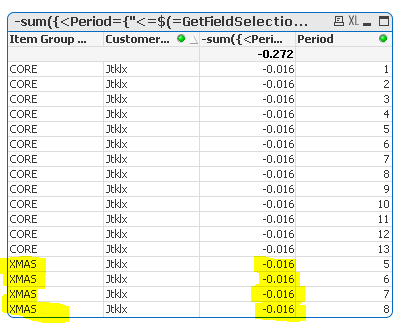
the Sales are showing but i can't get the [Carriage % of Sales] to display against the XMAS rows.
If you select periods 5,6,7 or 8 you will see the values correct against XMAS in [Carriage % of Sales].
I have the same problems for some other expressions, so i guess the same fix would fix the rest.
Any help would be appreciated.