Unlock a world of possibilities! Login now and discover the exclusive benefits awaiting you.
- Qlik Community
- :
- All Forums
- :
- QlikView App Dev
- :
- How can i change the color of data point
- Subscribe to RSS Feed
- Mark Topic as New
- Mark Topic as Read
- Float this Topic for Current User
- Bookmark
- Subscribe
- Mute
- Printer Friendly Page
- Mark as New
- Bookmark
- Subscribe
- Mute
- Subscribe to RSS Feed
- Permalink
- Report Inappropriate Content
How can i change the color of data point
Hi QV Guys,
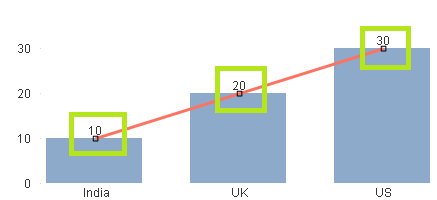
I have a requirement to show many trend lines in diff colors but the client requirement is data points has to show in diff color not as line color.
In this screen shot, the RED line is the exact requirement i want show
below is the screen shot for your reference
Regards
Hemanth
- « Previous Replies
-
- 1
- 2
- Next Replies »
Accepted Solutions
- Mark as New
- Bookmark
- Subscribe
- Mute
- Subscribe to RSS Feed
- Permalink
- Report Inappropriate Content

- Mark as New
- Bookmark
- Subscribe
- Mute
- Subscribe to RSS Feed
- Permalink
- Report Inappropriate Content
is this?
- Mark as New
- Bookmark
- Subscribe
- Mute
- Subscribe to RSS Feed
- Permalink
- Report Inappropriate Content
Hi Chanty,
Not the values in diff color.
iam in need of red line with yellow squares
Regards
Hemanth
- Mark as New
- Bookmark
- Subscribe
- Mute
- Subscribe to RSS Feed
- Permalink
- Report Inappropriate Content
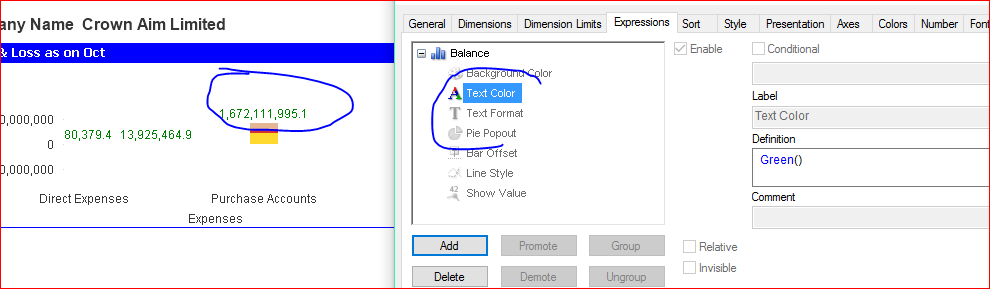
same + symbol in expression tab line style there you can give red() or green()
and down display options--->symbol--->Squares you will get it
- Mark as New
- Bookmark
- Subscribe
- Mute
- Subscribe to RSS Feed
- Permalink
- Report Inappropriate Content
Do you really need this for red line only, Then you must create one more expression for Yellow square. Like
Green - Sum(Sales)
Red - Sum(Sales1)
Yellow Square is -- Sum(Sales1) and then use Square for dummy expression and then change color what ever you want
- Mark as New
- Bookmark
- Subscribe
- Mute
- Subscribe to RSS Feed
- Permalink
- Report Inappropriate Content
here

- Mark as New
- Bookmark
- Subscribe
- Mute
- Subscribe to RSS Feed
- Permalink
- Report Inappropriate Content
Hi chanty,
Squares i can get but i need of yellow squares.
Regards
Hemanth
- Mark as New
- Bookmark
- Subscribe
- Mute
- Subscribe to RSS Feed
- Permalink
- Report Inappropriate Content
Hi Anil,
Could explain it little elobrate.
Regards
Hemanth
- Mark as New
- Bookmark
- Subscribe
- Mute
- Subscribe to RSS Feed
- Permalink
- Report Inappropriate Content
ohh Am not sure about it 
- Mark as New
- Bookmark
- Subscribe
- Mute
- Subscribe to RSS Feed
- Permalink
- Report Inappropriate Content
Thanks Chanty
- « Previous Replies
-
- 1
- 2
- Next Replies »