Unlock a world of possibilities! Login now and discover the exclusive benefits awaiting you.
- Qlik Community
- :
- All Forums
- :
- QlikView App Dev
- :
- How to Exclude Records
- Subscribe to RSS Feed
- Mark Topic as New
- Mark Topic as Read
- Float this Topic for Current User
- Bookmark
- Subscribe
- Mute
- Printer Friendly Page
- Mark as New
- Bookmark
- Subscribe
- Mute
- Subscribe to RSS Feed
- Permalink
- Report Inappropriate Content
How to Exclude Records
Hi,
I am using an IF function to identify a list of customers in the Master Table who satisfy certain criteria. I want use the output of this IF function, which contains list of customers, as input to another function to Exclude these list of customers from the Master Table. Can someone please suggest how to achieve this in QlikView. I have fair programming knowledge, but I am not familiar with QlikView syntax. I appreciate any help.
I have inluded a test data below. It lists 5 customers. I want to count only those customers who do not have license L9. I used the If (License = 'L9', (count(distinct [Customer Lits]))) comand to get the list of customers who Have L9 licenses. I now struggling to exclude this customers from the main list.
Unique Customer ID Customer List License
1 CustA L1
1 CustA L2
1 CustA L3
1 CustA L9
2 CustB L1
3 CustC L2
3 CustC L3
3 CustC L9
4 CustD L3
4 CustD L9
5 CustE L3
5 CustE L5
The Final Answer must list two customers - Cust B and Cust E, because they do not have license L9. The expression I wrote exclude "records" for Cust A with L9, but counts Cust A with L1, L2, and L3 as seperate records.
I expected to see following the bar chart. Bar Chart will have
Licenses -> Dimensions
Customer List -> Expressions.
X-Axis -> Licenses
Y-Axis -> Count(distinct[Customer List])
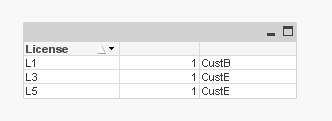
Expected result:
L1 -> 1
L3 -> 1
L5 -> 1
where Cust B has L1 and CustE has L3 and L5 licenses
Additional Challenge:
If L1 is the oldest license and L9 latest licence, how to display the latest license after you apply the above filter?
If you apply the logic on the output on the above result, the Expected Result in bar chart is:
L1 - 1
L5 - 1
Cust B has only one license L1
Cust E has L5 as the latest license
Thanks,
- Tags:
- filter
Accepted Solutions
- Mark as New
- Bookmark
- Subscribe
- Mute
- Subscribe to RSS Feed
- Permalink
- Report Inappropriate Content
dimension License
expression count(distinct {$<CustomerList = E({1<License={L9}>} CustomerList)>} CustomerList )
- Mark as New
- Bookmark
- Subscribe
- Mute
- Subscribe to RSS Feed
- Permalink
- Report Inappropriate Content
Add the field Customer List to a straight table as dimension. Next add one expression : sum({<License-={L9}>}1). Finally hide the expression on the Presentation tab.
talk is cheap, supply exceeds demand
- Mark as New
- Bookmark
- Subscribe
- Mute
- Subscribe to RSS Feed
- Permalink
- Report Inappropriate Content
Hi Gysbert,
Thanks for your prompt response. After applying your logic I cannot see the unique Customer in the bar Chart. I expected to see following the bar chart. Bar Chart will have Licenses as Dimensions, and Customer List as Expressions.
X-Axis -> Licenses
Y-Axis -> Count(distinct[Customer List])
Expected result:
L1 -> 1
L3 -> 1
L5 -> 1
where Cust B has L1 and CustE has L3 and L5 licenses
PS: I have added one more requirement to my originla question. Display latest licenses
- Mark as New
- Bookmark
- Subscribe
- Mute
- Subscribe to RSS Feed
- Permalink
- Report Inappropriate Content
See attached qvw.
talk is cheap, supply exceeds demand
- Mark as New
- Bookmark
- Subscribe
- Mute
- Subscribe to RSS Feed
- Permalink
- Report Inappropriate Content
dimension License
expression count(distinct {$<CustomerList = E({1<License={L9}>} CustomerList)>} CustomerList )
- Mark as New
- Bookmark
- Subscribe
- Mute
- Subscribe to RSS Feed
- Permalink
- Report Inappropriate Content
Hi Massimo,
Many thanks for your response. The logic worked. I appreciate your quick response.
Thanks,
Raghu
- Mark as New
- Bookmark
- Subscribe
- Mute
- Subscribe to RSS Feed
- Permalink
- Report Inappropriate Content
Please close this discussion by giving Correct and/or Helpful answers to the posts which are useful for you. It helps others in finding answers for similar scenarios. Thanks.
- Mark as New
- Bookmark
- Subscribe
- Mute
- Subscribe to RSS Feed
- Permalink
- Report Inappropriate Content
Hi Massimo,
I marked your response with correct answer.
Thanks,
Raghu