Unlock a world of possibilities! Login now and discover the exclusive benefits awaiting you.
- Qlik Community
- :
- All Forums
- :
- QlikView App Dev
- :
- How to compare two similar data sets using a chart...
- Subscribe to RSS Feed
- Mark Topic as New
- Mark Topic as Read
- Float this Topic for Current User
- Bookmark
- Subscribe
- Mute
- Printer Friendly Page
- Mark as New
- Bookmark
- Subscribe
- Mute
- Subscribe to RSS Feed
- Permalink
- Report Inappropriate Content
How to compare two similar data sets using a chart function ?
Hi all!
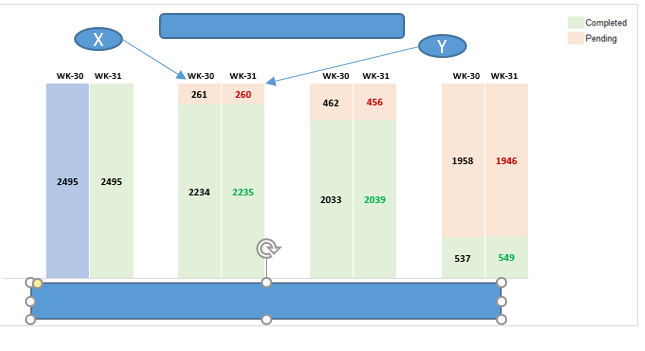
I have two data sets 'X' and 'Y' which are of similar data type having same header fields.
Eg; Data set 'X' is old data and 'Y' is the current refreshed data
How can I bring up these two data sets in a same bar graph next to each other as shown in the below snap?
Shall I store the data in two separate files or shall I just append these two data sets in single file ?
- Mark as New
- Bookmark
- Subscribe
- Mute
- Subscribe to RSS Feed
- Permalink
- Report Inappropriate Content
I think you should be able to append the two data sources, but may be add a flag to differentiate between old and new.... and then you can use this flag as one of the dimensions....
- Mark as New
- Bookmark
- Subscribe
- Mute
- Subscribe to RSS Feed
- Permalink
- Report Inappropriate Content
Can you plz elaborate more about the flag ? How to add it ?
- Mark as New
- Bookmark
- Subscribe
- Mute
- Subscribe to RSS Feed
- Permalink
- Report Inappropriate Content
I am not sure what is there to elaborate... but I can show you via a sample script... may be that will help clarify
Data:
LOAD blahblah...,
'OldData' as DataFlag
FROM OldData;
Concatenate (Data)
LOAD blahblah,
'NewData' as DataFlag
FROM NewData;
Now use DataFlag as your dimension
- Mark as New
- Bookmark
- Subscribe
- Mute
- Subscribe to RSS Feed
- Permalink
- Report Inappropriate Content
For the above code, data should be in different files/sheet right ?
It should not be appended.
- Mark as New
- Bookmark
- Subscribe
- Mute
- Subscribe to RSS Feed
- Permalink
- Report Inappropriate Content
Can you post some sample data???
Regards,
Please appreciate our Qlik community members by giving Kudos for sharing their time for your query. If your query is answered, please mark the topic as resolved 🙂
- Mark as New
- Bookmark
- Subscribe
- Mute
- Subscribe to RSS Feed
- Permalink
- Report Inappropriate Content
Not sure I understand