Unlock a world of possibilities! Login now and discover the exclusive benefits awaiting you.
- Qlik Community
- :
- All Forums
- :
- QlikView App Dev
- :
- How to create sequence based on start time for gan...
- Subscribe to RSS Feed
- Mark Topic as New
- Mark Topic as Read
- Float this Topic for Current User
- Bookmark
- Subscribe
- Mute
- Printer Friendly Page
- Mark as New
- Bookmark
- Subscribe
- Mute
- Subscribe to RSS Feed
- Permalink
- Report Inappropriate Content
How to create sequence based on start time for gantt chart
Hi ,
I have few jobs that are running few times in a day. In my data model I have jobs start time and end time.
I have stack gantt chart where I am plotting this information .
So I need to create jobs sequence based on the jobs start time.
My load script looks like the following:
Spike:
LOAD *,
Interval(End_Time - Start_Time,'mm:ss') as Diff;
LOAD JobName,
....
.....
date(Start_Time,'DD-MM-YYYY hh:mm:ss') as Start_Time,
date(End_Time,'DD-MM-YYYY hh:mm:ss') as End_Time,
DATE(FLOOR(Start_Time), 'DD-MMM-YY') as Date
FROM
[..\xxx.qvd]
(qvd);
Temp1:
load *,
RowNo() as tmpEvent
Resident Spike;
Test:
NoConcatenate
LOAD *,
AutoNumber(tmpEvent, JobName) as Event
Resident Temp1;
Drop Field tmpEvent;
Drop table Temp1;
drop table Spike;
My gantt chart looks like the following: Nothing to be modified in the chart , it looks good.
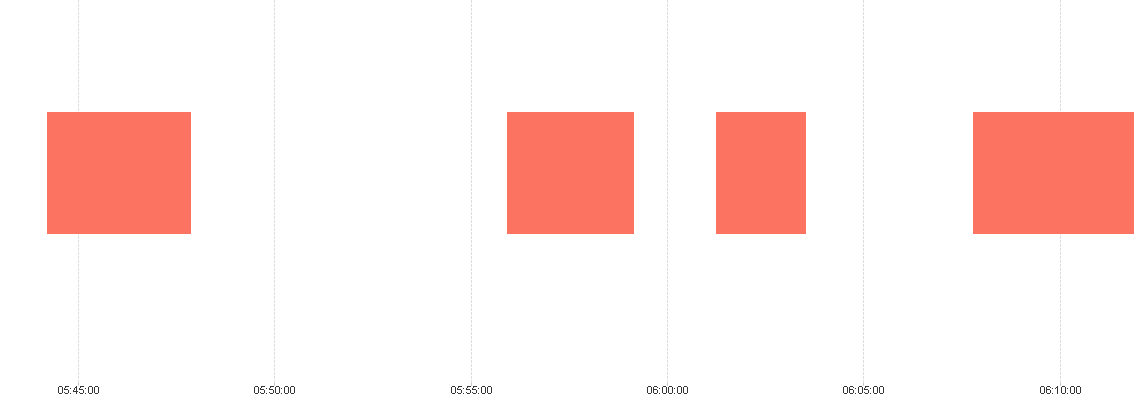
The Event field is giving me jobs sequence.
However I noticed that it is not giving correct sequence based on the start time of the job, if I plot straight table and get job , start time, end time, and Event.
Could you please help me how do I get this Event based on the jobs start time. So if the job start first the sequence would be 1 and then subsequently it would show 2,3,.....N
Currently it is showing like the following:

Thank you,
Ashis
- « Previous Replies
- Next Replies »
- Mark as New
- Bookmark
- Subscribe
- Mute
- Subscribe to RSS Feed
- Permalink
- Report Inappropriate Content
Hello @ashis ,
I have same requirement for creating a Gantt chart based on start time and end time of room reserved or available. Can you share how you have created Gantt chart and code for that?
Thank you!!
- « Previous Replies
- Next Replies »