Unlock a world of possibilities! Login now and discover the exclusive benefits awaiting you.
- Qlik Community
- :
- All Forums
- :
- QlikView App Dev
- :
- How to create this chart?
- Subscribe to RSS Feed
- Mark Topic as New
- Mark Topic as Read
- Float this Topic for Current User
- Bookmark
- Subscribe
- Mute
- Printer Friendly Page
- Mark as New
- Bookmark
- Subscribe
- Mute
- Subscribe to RSS Feed
- Permalink
- Report Inappropriate Content
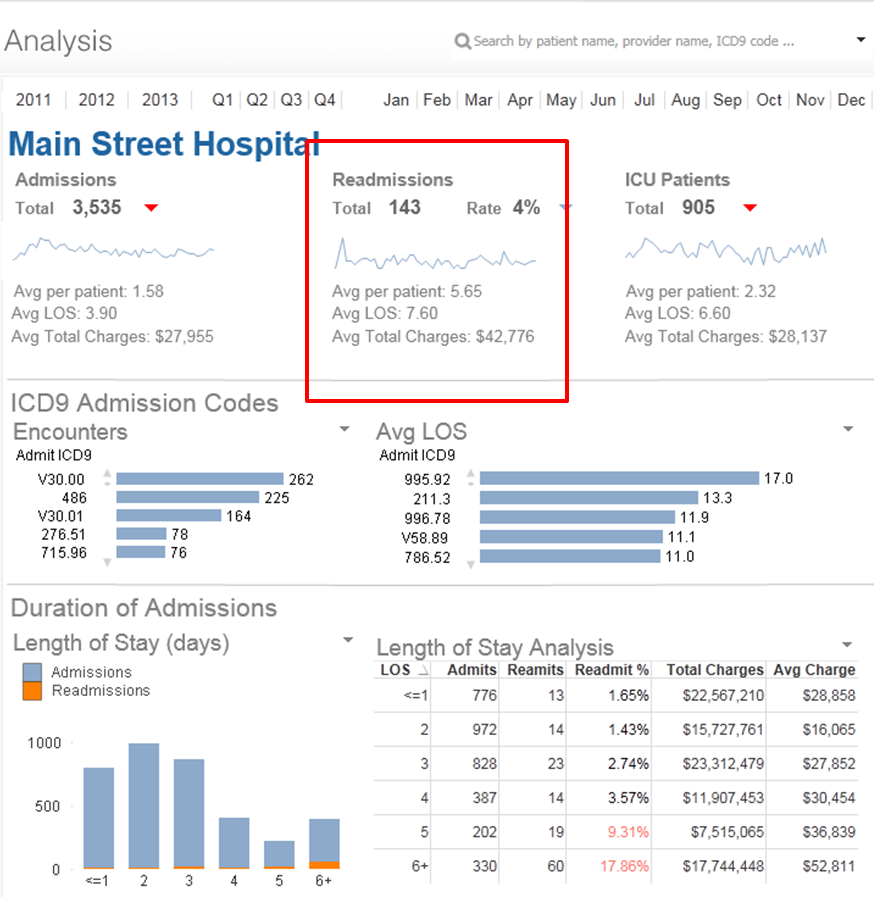
How to create this chart?
Hello,
I saw this dashboard on Qlikview as a sample and wondered how to create it? Is it made up of multiple text boxes with custom expressions? Or is there a chart function you can use to do this?
I am currently using Qlikview Personal Edition, so am unable to view attached qvw files. Any explanation would be helpful.
Thanks, Thuy
Accepted Solutions
- Mark as New
- Bookmark
- Subscribe
- Mute
- Subscribe to RSS Feed
- Permalink
- Report Inappropriate Content
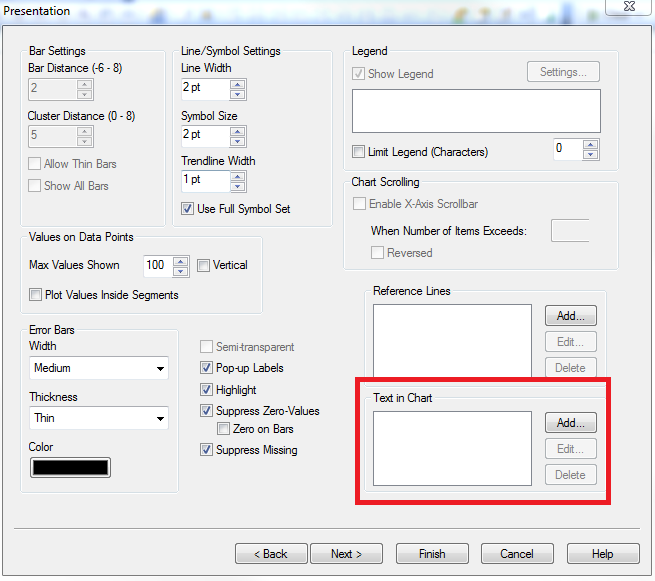
It could be a line chart with multiple text boxes, or it could be a line chart with multiple "Text in Chart" values:
- Mark as New
- Bookmark
- Subscribe
- Mute
- Subscribe to RSS Feed
- Permalink
- Report Inappropriate Content
It could be a line chart with multiple text boxes, or it could be a line chart with multiple "Text in Chart" values:
- Mark as New
- Bookmark
- Subscribe
- Mute
- Subscribe to RSS Feed
- Permalink
- Report Inappropriate Content
It's a set of textboxes and one chart. You can check this on your own here: QlikView
Lukasz