Unlock a world of possibilities! Login now and discover the exclusive benefits awaiting you.
Announcements
April 13–15 - Dare to Unleash a New Professional You at Qlik Connect 2026: Register Now!
- Qlik Community
- :
- All Forums
- :
- QlikView App Dev
- :
- How to plot a duration distribution graph?
Options
- Subscribe to RSS Feed
- Mark Topic as New
- Mark Topic as Read
- Float this Topic for Current User
- Bookmark
- Subscribe
- Mute
- Printer Friendly Page
Turn on suggestions
Auto-suggest helps you quickly narrow down your search results by suggesting possible matches as you type.
Showing results for
Not applicable
2015-12-16
11:16 PM
- Mark as New
- Bookmark
- Subscribe
- Mute
- Subscribe to RSS Feed
- Permalink
- Report Inappropriate Content
How to plot a duration distribution graph?
Hello,
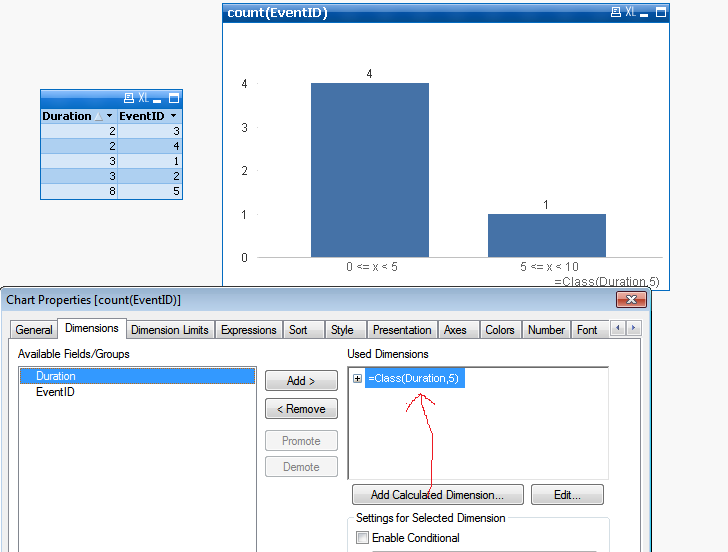
I have the following table:
EventID : Duration (in minutes)
1 : 3
2 : 3
3 : 2
4 : 2
5 : 8
I need to create a graph that displays a "bucket" of Durations in the x axis and the count of Events within that bucket, like below
Duration : Number of Events
0 - 5 : 4
5 - 10 : 1
10 - 20 : 0
more than 20 : 0
I was pretty sure I needed a calculated dimension of aggr(count(EventID),Duration), but that didn't work...
Any ideas?
Thanks!!
531 Views
1 Reply
Not applicable
2015-12-17
08:33 AM
Author
- Mark as New
- Bookmark
- Subscribe
- Mute
- Subscribe to RSS Feed
- Permalink
- Report Inappropriate Content
383 Views