Unlock a world of possibilities! Login now and discover the exclusive benefits awaiting you.
- Qlik Community
- :
- All Forums
- :
- QlikView App Dev
- :
- How to remove specific values of a field in a sum ...
- Subscribe to RSS Feed
- Mark Topic as New
- Mark Topic as Read
- Float this Topic for Current User
- Bookmark
- Subscribe
- Mute
- Printer Friendly Page
- Mark as New
- Bookmark
- Subscribe
- Mute
- Subscribe to RSS Feed
- Permalink
- Report Inappropriate Content
How to remove specific values of a field in a sum expression
Hello everyone,
I need to create a bar chart which displays the sum of specific values of a field called "Categoria".
Below is the printscreen of the field in my data base:
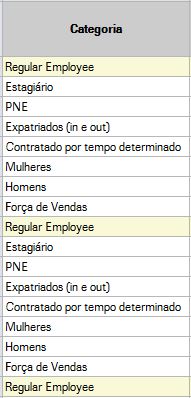
I don´t want to sum the values "Mulheres" and "Homens", it should be removed from the result of the sum.
Thanks,
- Tags:
- new_to_qlikview
- « Previous Replies
-
- 1
- 2
- Next Replies »
- Mark as New
- Bookmark
- Subscribe
- Mute
- Subscribe to RSS Feed
- Permalink
- Report Inappropriate Content
cud u share your expression?
- Mark as New
- Bookmark
- Subscribe
- Mute
- Subscribe to RSS Feed
- Permalink
- Report Inappropriate Content
some of the above solutions will work and the othr way
on ur dimension tab
=If(Categoris ='Mulheres',Null(),
If(Categoris ='Homens',Null(),Categoris ))
or
=If(Categoris ='Mulheres',Null(),
If(Categoris ='Homens',Null(),year ))
and click check box,supress null values and ur expression is sum(specific values)
that helps
- Mark as New
- Bookmark
- Subscribe
- Mute
- Subscribe to RSS Feed
- Permalink
- Report Inappropriate Content
At the dimension level:
if(Categoria<>'Mulheres' and Categoria<>'Homens', Categoria)
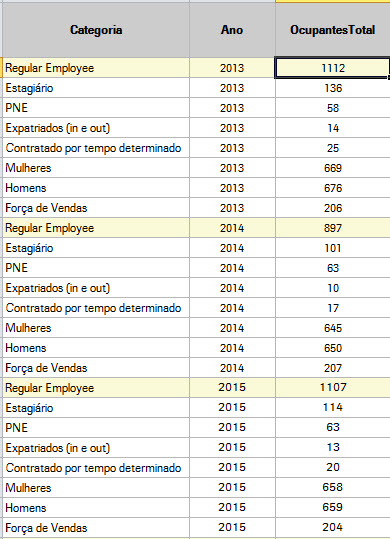
Here is my expression:
sum([OcupantesTotal])/sum({<Categoria={'Regular Employee'}>}[OcupantesTotal]))
It seem the result calculation is for all years, and my expression needs to give me the sum of each year.
- « Previous Replies
-
- 1
- 2
- Next Replies »