Unlock a world of possibilities! Login now and discover the exclusive benefits awaiting you.
- Qlik Community
- :
- All Forums
- :
- QlikView App Dev
- :
- Is it posible to do a bar chart Clustered column l...
- Subscribe to RSS Feed
- Mark Topic as New
- Mark Topic as Read
- Float this Topic for Current User
- Bookmark
- Subscribe
- Mute
- Printer Friendly Page
- Mark as New
- Bookmark
- Subscribe
- Mute
- Subscribe to RSS Feed
- Permalink
- Report Inappropriate Content
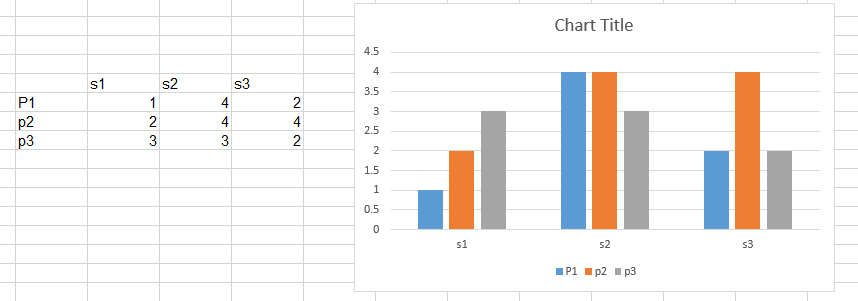
Is it posible to do a bar chart Clustered column like in excel ?
- Tags:
- new_to_qlikview
- « Previous Replies
-
- 1
- 2
- Next Replies »
- Mark as New
- Bookmark
- Subscribe
- Mute
- Subscribe to RSS Feed
- Permalink
- Report Inappropriate Content
Yes of course
This is an example,
as you can see I have p1 with 3 avg ,
and I need s1 with p1,p2,p3
Thanks for the help
- Mark as New
- Bookmark
- Subscribe
- Mute
- Subscribe to RSS Feed
- Permalink
- Report Inappropriate Content
From what I can see, the qvw Michael Woolf posted is correct. Are you saying it isn't correct because his data is loaded differently than yours is? That seems to be the key difference between the qvw you just posted and the one he had posted
- Mark as New
- Bookmark
- Subscribe
- Mute
- Subscribe to RSS Feed
- Permalink
- Report Inappropriate Content
Its not please take another look its answering my problem
- Mark as New
- Bookmark
- Subscribe
- Mute
- Subscribe to RSS Feed
- Permalink
- Report Inappropriate Content
He got three different things p and s as the dimensions a the sum of q
I have the product as a dimention and s1,s2,s3 as the avg
- Mark as New
- Bookmark
- Subscribe
- Mute
- Subscribe to RSS Feed
- Permalink
- Report Inappropriate Content
Well then one way to change yours could be to implement a cross table in your load script if you'd like to, otherwise i'm not sure what else to do. Sorry I can't help
- « Previous Replies
-
- 1
- 2
- Next Replies »