Unlock a world of possibilities! Login now and discover the exclusive benefits awaiting you.
- Qlik Community
- :
- All Forums
- :
- QlikView App Dev
- :
- Line Chart: Set a Background Color by Range
- Subscribe to RSS Feed
- Mark Topic as New
- Mark Topic as Read
- Float this Topic for Current User
- Bookmark
- Subscribe
- Mute
- Printer Friendly Page
- Mark as New
- Bookmark
- Subscribe
- Mute
- Subscribe to RSS Feed
- Permalink
- Report Inappropriate Content
Line Chart: Set a Background Color by Range
Hello,
I have a line chart with 2 dimensions:
X axis: time (hh:mm:ss AM/PM)
Y axis: total value
What I need is to set a background colour for a time period like this:
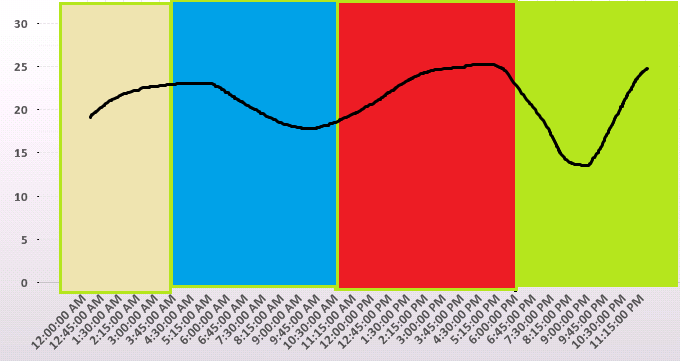
For example, from 6:00:00 PM to 11:15:00 I need to paint it with a green background and so on with other ranges.
Do you know how could I do that?
Thank you!
- Tags:
- new_to_qlikview
- Mark as New
- Bookmark
- Subscribe
- Mute
- Subscribe to RSS Feed
- Permalink
- Report Inappropriate Content
Hi, there you have an approach attached, there is not a native way to do this, but you can try something with this example.
In the second expression into the combined chart, in the '+' simbol you have the expression properties, there you must define into "Background color" propertie the ranges of dates and the needed color following the little example.
Hope it helps!
Best Regards
Jonathan.