Unlock a world of possibilities! Login now and discover the exclusive benefits awaiting you.
- Qlik Community
- :
- All Forums
- :
- QlikView App Dev
- :
- Line chart - axis formatting
- Subscribe to RSS Feed
- Mark Topic as New
- Mark Topic as Read
- Float this Topic for Current User
- Bookmark
- Subscribe
- Mute
- Printer Friendly Page
- Mark as New
- Bookmark
- Subscribe
- Mute
- Subscribe to RSS Feed
- Permalink
- Report Inappropriate Content
Line chart - axis formatting
Hi,
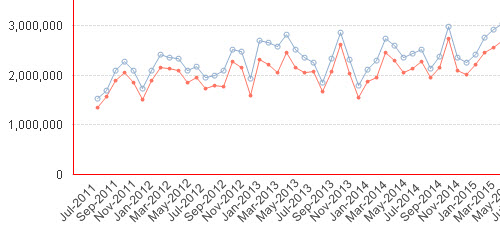
I'm looking at a QV app that was created by someone else. How do you format the x-axis so the text is
being shown at an "angle"? See attached screenshot. I've looked through the settings for Line Chart but not able
to determine which property to set or configure. Please kindly let me know.
Accepted Solutions
- Mark as New
- Bookmark
- Subscribe
- Mute
- Subscribe to RSS Feed
- Permalink
- Report Inappropriate Content
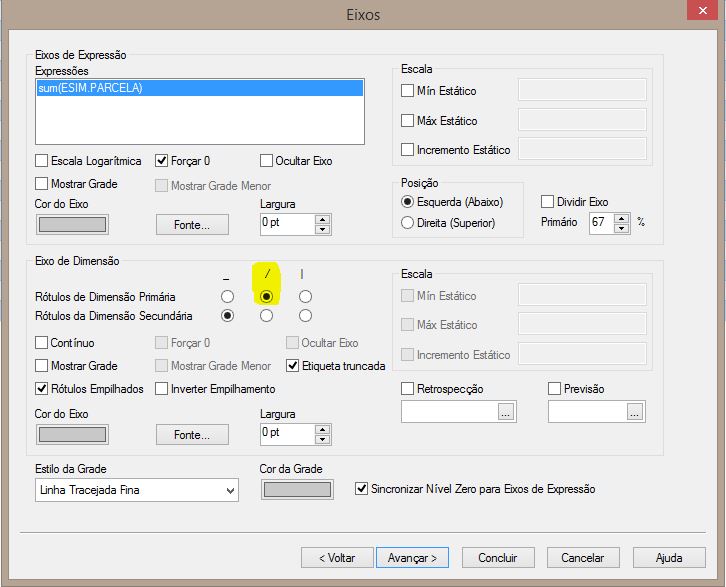
Nevermind, i just found it. It's under Primary dimension label.
- Mark as New
- Bookmark
- Subscribe
- Mute
- Subscribe to RSS Feed
- Permalink
- Report Inappropriate Content
Nevermind, i just found it. It's under Primary dimension label.
- Mark as New
- Bookmark
- Subscribe
- Mute
- Subscribe to RSS Feed
- Permalink
- Report Inappropriate Content
- Mark as New
- Bookmark
- Subscribe
- Mute
- Subscribe to RSS Feed
- Permalink
- Report Inappropriate Content
Thanks Marcio.
- Mark as New
- Bookmark
- Subscribe
- Mute
- Subscribe to RSS Feed
- Permalink
- Report Inappropriate Content
Your welcome.
- Mark as New
- Bookmark
- Subscribe
- Mute
- Subscribe to RSS Feed
- Permalink
- Report Inappropriate Content
I have another question but related to my initial screenshot. The x-axis has labels like "JUL-2011" which composes of the month and the year. How do you format it so that it comes out in chronological order with JULY being the first month of the fiscal year and JUNE being the last? I tried using the DUAL() function but it did not work for me.
I get multiple years (example: I see 2014 when I picked 2016). In my table, I have a field called MonthYear which is already formatted to JUL-2011, AUG-2011 .... JUN-2012. I also have another field called MonthSort - example 1 for JUL, 2 for AUG and 12 for JUN. Finally in my load statement, I have something like DUAL(MonthYear, MonthSort) as 'MonthYear'.
This does not work. My x-axis has years that I don't expect to have.
Can someone help?