Unlock a world of possibilities! Login now and discover the exclusive benefits awaiting you.
- Qlik Community
- :
- All Forums
- :
- QlikView App Dev
- :
- Newbie question - Showing statistics using objects
- Subscribe to RSS Feed
- Mark Topic as New
- Mark Topic as Read
- Float this Topic for Current User
- Bookmark
- Subscribe
- Mute
- Printer Friendly Page
- Mark as New
- Bookmark
- Subscribe
- Mute
- Subscribe to RSS Feed
- Permalink
- Report Inappropriate Content
Newbie question - Showing statistics using objects
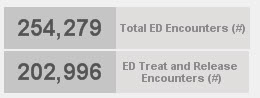
I am a Qlikview newbie and am trying to add a few statistics boxes to my dashboard. I basically want to show a statistics box with total charges for all patients when no selections are made and then when selections are made, the statistics box would only show the actual number. I'm not sure what type of object I should be using for this or if the below image consists of one or two object boxes. I'm trying to get to the display below.
Accepted Solutions
- Mark as New
- Bookmark
- Subscribe
- Mute
- Subscribe to RSS Feed
- Permalink
- Report Inappropriate Content
You probably missed the equal sign?
I don't know if you should use a text object, but you can of course could use one. It's not so unusal to use text boxes for some dashboard measures like shown in your original post.
- Mark as New
- Bookmark
- Subscribe
- Mute
- Subscribe to RSS Feed
- Permalink
- Report Inappropriate Content
If you just use an expression in a textbox, like
=sum(Value)
This will show your value which will automatically reflect selections in any field. format the number using num() function if needed. I think above sample consists of four text objects, two showing the numbers, two the descriptive text. I think so, because you can concatenate an expression that gives you a number with a text, but you can't format the parts differently (text style, color, font).
Hope this helps,
Stefan
- Mark as New
- Bookmark
- Subscribe
- Mute
- Subscribe to RSS Feed
- Permalink
- Report Inappropriate Content
Thanks for the quick response. Should I use a text object? I see that I can add an expression but when I paste the object, it only shows the actual expression, not the number itself.
- Mark as New
- Bookmark
- Subscribe
- Mute
- Subscribe to RSS Feed
- Permalink
- Report Inappropriate Content
Write those expressions with set analysis in a Povited Table(expressions tab).
In Caption tab, uncheck the 'show caption' option.
save properties and drag the columns to rotate them to view as rows
- Mark as New
- Bookmark
- Subscribe
- Mute
- Subscribe to RSS Feed
- Permalink
- Report Inappropriate Content
You probably missed the equal sign?
I don't know if you should use a text object, but you can of course could use one. It's not so unusal to use text boxes for some dashboard measures like shown in your original post.