Unlock a world of possibilities! Login now and discover the exclusive benefits awaiting you.
- Qlik Community
- :
- All Forums
- :
- QlikView App Dev
- :
- Past 7 Weekdata's display
- Subscribe to RSS Feed
- Mark Topic as New
- Mark Topic as Read
- Float this Topic for Current User
- Bookmark
- Subscribe
- Mute
- Printer Friendly Page
- Mark as New
- Bookmark
- Subscribe
- Mute
- Subscribe to RSS Feed
- Permalink
- Report Inappropriate Content
Past 7 Weekdata's display
Hi,
I have week day data which will be starting like 6/16/2014, 6/23/2014, 6/30/2014, 7/7/2014, 7/14/2014, 7/21/2014, 7/28/2014, 8/4/2014, 8/11/2014, 8/18/2014 etc..
Pls find the attached sample data. I need to create a straight table chart which should display past 7 weeks data.
So I have list box of WeekDate (I have selected: Always One Selected Value), example when I select 8/18/2014 in list box, then my straight table chart should display past 7 weeks data from 7/7/2014 to 8/18/2014.
The same way when I select 8/11/2014 then my straight table chart should display past 7 week data from 6/30/2104 to 8/11/2014.
and so on...
Can you please help me to achieve.
Thanks,
Thimma
Accepted Solutions
- Mark as New
- Bookmark
- Subscribe
- Mute
- Subscribe to RSS Feed
- Permalink
- Report Inappropriate Content
Dear Madu,
Create 2 variables.
1)
vMaxWeekDate
=Max(WeekDate)
2) vMaxWeekDate_7
==Date(vMaxWeekDate-49)
Then create a chart.
Dimension:
WeekDate
Expression:
=Sum({<WeekDate = {">$(vMaxWeekDate_7)<=$(vMaxWeekDate)"}>}SoldAmt)
i hope it will full fill your requirement.
Thanks,
Mukram
- Mark as New
- Bookmark
- Subscribe
- Mute
- Subscribe to RSS Feed
- Permalink
- Report Inappropriate Content
Dear,
Kindly find the attached file.
i hope it will full fill your requirement.
Thanks,
Mukram
- Mark as New
- Bookmark
- Subscribe
- Mute
- Subscribe to RSS Feed
- Permalink
- Report Inappropriate Content
Thanks for the response, but I am using personal edition. Can you let me know the logic, so that I can try in my pc.
- Mark as New
- Bookmark
- Subscribe
- Mute
- Subscribe to RSS Feed
- Permalink
- Report Inappropriate Content
Hi,
Using set analysis may be it will possible.
try this
sum({<weekday={'=max(weekday)-49'}>} Sales)
here 49 is 7prev week's and each week has 7 days so 7*7
i don't know whether it will work or not
- Mark as New
- Bookmark
- Subscribe
- Mute
- Subscribe to RSS Feed
- Permalink
- Report Inappropriate Content
Hi,
Try below
Code:
LOAD WeekDate,
Week(WeekDate) as Week,
     SoldAmt
FROM
[WeekData testing.xlsx]
(ooxml, embedded labels, table is Sheet1);
Create two variables
Variable 1
Name: vMaxWeek
Defination: =Max(Week)
Variable 1
Name: vlast7Weeks
Defination: =vMaxWeek-7
Now create straight table
Dimension:
WeekDate
Week
Expression:
=Sum({<Week = {">$(vlast7Weeks)<=$(vMaxWeek)"},WeekDate=>}SoldAmt)
Now select any week date it will rollback for last 7 weeks
Regards
ASHFAQ
- Mark as New
- Bookmark
- Subscribe
- Mute
- Subscribe to RSS Feed
- Permalink
- Report Inappropriate Content
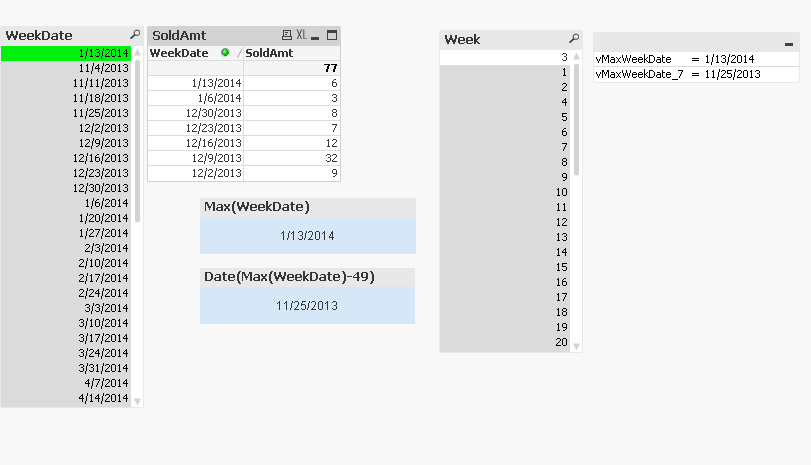
This looks fine Ashfaq, but what happens if I have multiple years and if I select 1/13/2014 then I supposed to get below data
| 12/2/2013 |
| 12/9/2013 |
| 12/16/2013 |
| 12/23/2013 |
| 12/30/2013 |
| 1/6/2014 |
| 1/13/2014 |
but I am not getting that 
Attached is the updated source file.
- Mark as New
- Bookmark
- Subscribe
- Mute
- Subscribe to RSS Feed
- Permalink
- Report Inappropriate Content
I think you have to do a week counter (1..50....200, don't restart with week 1 in january)
and then use a set analysis to filter last 7 weekcounter (max weekcounter is the one associated to selected week)
- Mark as New
- Bookmark
- Subscribe
- Mute
- Subscribe to RSS Feed
- Permalink
- Report Inappropriate Content
Dear Madu,
Create 2 variables.
1)
vMaxWeekDate
=Max(WeekDate)
2) vMaxWeekDate_7
==Date(vMaxWeekDate-49)
Then create a chart.
Dimension:
WeekDate
Expression:
=Sum({<WeekDate = {">$(vMaxWeekDate_7)<=$(vMaxWeekDate)"}>}SoldAmt)
i hope it will full fill your requirement.
Thanks,
Mukram
- Mark as New
- Bookmark
- Subscribe
- Mute
- Subscribe to RSS Feed
- Permalink
- Report Inappropriate Content
It worked as expected and superb solution.
Thanks,