Unlock a world of possibilities! Login now and discover the exclusive benefits awaiting you.
- Qlik Community
- :
- All Forums
- :
- QlikView App Dev
- :
- Pie Chart Help
- Subscribe to RSS Feed
- Mark Topic as New
- Mark Topic as Read
- Float this Topic for Current User
- Bookmark
- Subscribe
- Mute
- Printer Friendly Page
- Mark as New
- Bookmark
- Subscribe
- Mute
- Subscribe to RSS Feed
- Permalink
- Report Inappropriate Content
Pie Chart Help
Hey Everyone,
I had a question involving pie charts. Im attempting to create a pie chart that uses the latest date entry from a table. Since there are many different entries within the table, i do not know how to direct the pie chart only to select the most recent date entries.
an example chart
Entry Date Reports in Progress Reports Completed
5/9/2011 5 6
5/16/2011 4 7
5/23/2011 7 5
5/30/2011 9 3
*6/6/2011 *5 *8
*information i need the chart from
My goal is a pie chart that, for this week, would display the reports in progress (5) compared to the reports completed (8), yet only using the data entries for 6/6/2011
i tried playing around with min/max aggregations within dimensions and expressions, and im stumped. Am i missing anything?
any help is appreciated
Accepted Solutions
- Mark as New
- Bookmark
- Subscribe
- Mute
- Subscribe to RSS Feed
- Permalink
- Report Inappropriate Content
hi,
EntryDate is the field you have in your first column in your original post. I cahnges its name because I had to process it a bit in order to create an accepatble date in my qv document.
here is how I loaded the data:
load
makedate(right([Entry Date],4),subfield([Entry Date],'/',1),subfield([Entry Date],'/',2)) as EntryDate,
[Reports in Progress] ,
[Reports Completed];
load * inline
[
Entry Date, Reports in Progress , Reports Completed
5/9/2011, 5 , 6
5/16/2011, 4 , 7
5/23/2011, 7 , 5
5/30/2011, 9 , 3
6/6/2011, 5 , 8
];
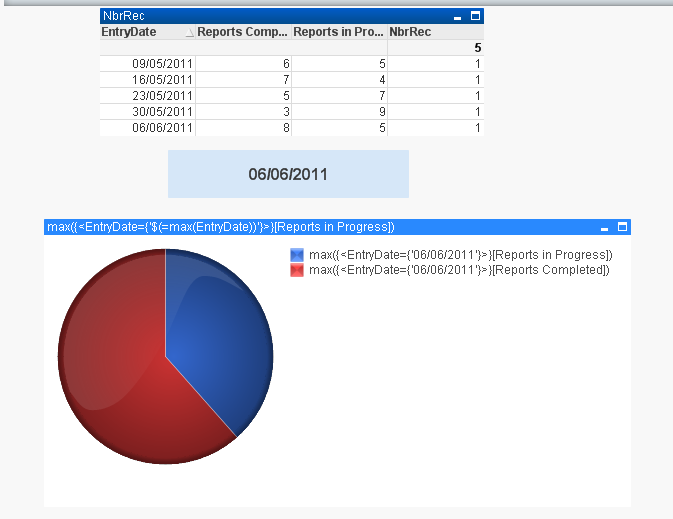
use that couple with the expressions and teh cahrt should display like this:
- Mark as New
- Bookmark
- Subscribe
- Mute
- Subscribe to RSS Feed
- Permalink
- Report Inappropriate Content
hi,
try using set nalysis with a set identifier - see attached qvw.
pie cahrt has no dimensions and two expressions like this:
max({<EntryDate={'$(=max(EntryDate))'}>}[Reports in Progress])
max({<EntryDate={'$(=max(EntryDate))'}>}[Reports Completed])
where entrydate is your date field
- Mark as New
- Bookmark
- Subscribe
- Mute
- Subscribe to RSS Feed
- Permalink
- Report Inappropriate Content
Hey pat, thanks for getting back to me
I'm a qlikview personal user, so i couldnt access your sample piechart.
but i tried what you wrote, creating a chart without dimensions, with the two expressions that you listed, and it came up without data to display.
The first EntryDate, did you write that as a field, or was I supposed to add the date there?
- Mark as New
- Bookmark
- Subscribe
- Mute
- Subscribe to RSS Feed
- Permalink
- Report Inappropriate Content
hi,
EntryDate is the field you have in your first column in your original post. I cahnges its name because I had to process it a bit in order to create an accepatble date in my qv document.
here is how I loaded the data:
load
makedate(right([Entry Date],4),subfield([Entry Date],'/',1),subfield([Entry Date],'/',2)) as EntryDate,
[Reports in Progress] ,
[Reports Completed];
load * inline
[
Entry Date, Reports in Progress , Reports Completed
5/9/2011, 5 , 6
5/16/2011, 4 , 7
5/23/2011, 7 , 5
5/30/2011, 9 , 3
6/6/2011, 5 , 8
];
use that couple with the expressions and teh cahrt should display like this:
- Mark as New
- Bookmark
- Subscribe
- Mute
- Subscribe to RSS Feed
- Permalink
- Report Inappropriate Content
Thanks Thats a huge help.
any idea how to change the '06/06/2011' part to always take the most recent date? I would be adding data to the table as the year progresses, and i would like the chart to always refresh to the most current week
- Mark as New
- Bookmark
- Subscribe
- Mute
- Subscribe to RSS Feed
- Permalink
- Report Inappropriate Content
that is how it operates.
the expression
max({<EntryDate={'$(=max(EntryDate))'}>}[Reports in Progress])
does exactly that. next week it will take whatever the latest date it is you have loaded.
- Mark as New
- Bookmark
- Subscribe
- Mute
- Subscribe to RSS Feed
- Permalink
- Report Inappropriate Content
awesome. I appreciate all the help