Unlock a world of possibilities! Login now and discover the exclusive benefits awaiting you.
- Qlik Community
- :
- All Forums
- :
- QlikView App Dev
- :
- Pie chart - Include boundary values
- Subscribe to RSS Feed
- Mark Topic as New
- Mark Topic as Read
- Float this Topic for Current User
- Bookmark
- Subscribe
- Mute
- Printer Friendly Page
- Mark as New
- Bookmark
- Subscribe
- Mute
- Subscribe to RSS Feed
- Permalink
- Report Inappropriate Content
Pie chart - Include boundary values
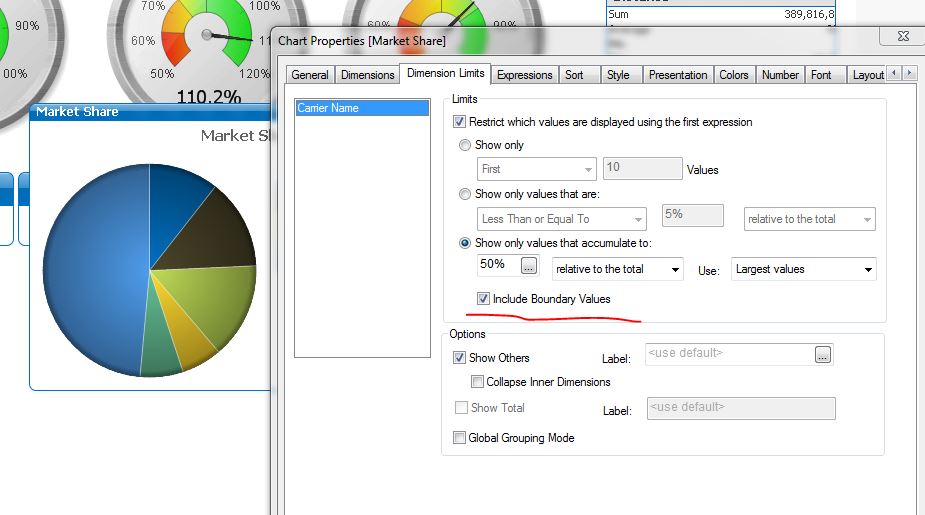
What is that option for ?
Select the Show only values that accumulate to radio button and set the corresponding value to 50% relative to the total. Enable the Include Boundary Values checkbox as well.
- Mark as New
- Bookmark
- Subscribe
- Mute
- Subscribe to RSS Feed
- Permalink
- Report Inappropriate Content
where you get this options can you post snipping shot images, so i will try to help you.
Thanks & regards
Venu
- Mark as New
- Bookmark
- Subscribe
- Mute
- Subscribe to RSS Feed
- Permalink
- Report Inappropriate Content
Show only values that accumulate to:
When this option is selected,all rows up to the current row are accumulated, and the result is
compared to the value set in the option. The relative to the total option enables a relative
mode which is similar to the Relative option on the Expressions tab of the property dialog,
and compares the accumulated values (based on first, largest or smallest values) to the overall
total. The value may be entered as a calculated formula. Click on the ... button to open the
Edit Expression Dialog . Select Include Boundary Values to include the dimension
value that contains the comparison value.
Note!
Negative values will not be included when calculating the accumulated restriction sum. We
recommend that you don't use relative restrictions for fields that can contain negative values.
- Mark as New
- Bookmark
- Subscribe
- Mute
- Subscribe to RSS Feed
- Permalink
- Report Inappropriate Content
image here -

- Mark as New
- Bookmark
- Subscribe
- Mute
- Subscribe to RSS Feed
- Permalink
- Report Inappropriate Content
Pie charts are evil ![]()
And using pie charts with dimension limit makes them worse ![]()
![]()
![]()
Well, if you don't use this check box, you get the set of slices which in the "non-limited" version took just under 50%. If you check the box, you add the next largest slice.
(It makes little sense to me to use pie chart in this way)
Edit: in case of the pie chart, do not uncheck "show others".
- Mark as New
- Bookmark
- Subscribe
- Mute
- Subscribe to RSS Feed
- Permalink
- Report Inappropriate Content
Hi John,
Look at the two pie charts in the attached QlikView document.
Both show values that accumulate to 80%.
In the first one the Include Boundary Values option is checked and the result is that the values shown accumulate to 90%.
In the second one one the Include Boundary Values option is not checked and the result is that the values shown accumulate to 70%.
I hope it helps.
Carlos
- Mark as New
- Bookmark
- Subscribe
- Mute
- Subscribe to RSS Feed
- Permalink
- Report Inappropriate Content
I am still not able to see the % symbol.