Unlock a world of possibilities! Login now and discover the exclusive benefits awaiting you.
- Qlik Community
- :
- All Forums
- :
- QlikView App Dev
- :
- Pivot Table
- Subscribe to RSS Feed
- Mark Topic as New
- Mark Topic as Read
- Float this Topic for Current User
- Bookmark
- Subscribe
- Mute
- Printer Friendly Page
- Mark as New
- Bookmark
- Subscribe
- Mute
- Subscribe to RSS Feed
- Permalink
- Report Inappropriate Content
Pivot Table
Hi Friends,
Below is the sample data which i need to convert to pivot in expected format. Have attached both the details. How can we achieve this ?
Any help will be appreciated.
Input Data:
| REGION | City | Value |
| East | Bhubaneshwar | 22.9 |
| East | Guwahati | 1.9 |
| East | Kolkotta | 1.9 |
| East | Patna | 5.4 |
| North | Chandigarh | 2.4 |
| North | Delhi | 3.8 |
| North | Lucknow | 2.4 |
| South | Bangalore | 2.1 |
| South | Chennai | 4.3 |
| South | Hyderabad | 1.9 |
| South | Trivandrum | 1.6 |
| West | Ahemadabad | 2.1 |
| West | Bhopal | 1.8 |
| West | Mumbai | 1.8 |
Expected result
| REGION | City | Value |
| East | Bhubaneshwar | 22.9 |
| East | Guwahati | 1.9 |
| East | Kolkotta | 1.9 |
| East | Patna | 5.4 |
| East Total | 8.0 | |
| North | Chandigarh | 2.4 |
| North | Delhi | 3.8 |
| North | Lucknow | 2.4 |
| North Total | 2.9 | |
| South | Bangalore | 2.1 |
| South | Chennai | 4.3 |
| South | Hyderabad | 1.9 |
| South | Trivandrum | 1.6 |
| Total | 2.5 | |
| West | Ahemadabad | 2.1 |
| West | Bhopal | 1.8 |
| West | Mumbai | 1.8 |
| Total | 2.1 | |
| Total | 3.6 |
Accepted Solutions
- Mark as New
- Bookmark
- Subscribe
- Mute
- Subscribe to RSS Feed
- Permalink
- Report Inappropriate Content
It seems that Totals are the avg for the region... Something like this?
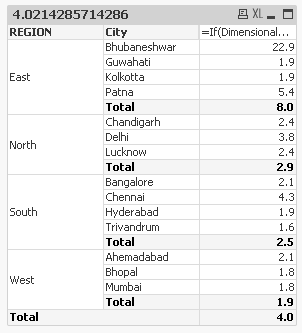
Expression used:
=If(Dimensionality() = 2, Sum(Value), Avg(Value))
- Mark as New
- Bookmark
- Subscribe
- Mute
- Subscribe to RSS Feed
- Permalink
- Report Inappropriate Content
How are the totals getting calculated?
- Mark as New
- Bookmark
- Subscribe
- Mute
- Subscribe to RSS Feed
- Permalink
- Report Inappropriate Content
It seems that Totals are the avg for the region... Something like this?
Expression used:
=If(Dimensionality() = 2, Sum(Value), Avg(Value))
- Mark as New
- Bookmark
- Subscribe
- Mute
- Subscribe to RSS Feed
- Permalink
- Report Inappropriate Content
It looked that your totals are the average, right? Then you could use:
avg(Value)
or if you need to sum the value on the city-level with an aggr-function, like:
avg(aggr(sum(Value), City))
- Marcus
- Mark as New
- Bookmark
- Subscribe
- Mute
- Subscribe to RSS Feed
- Permalink
- Report Inappropriate Content
Thanks Marcus