Unlock a world of possibilities! Login now and discover the exclusive benefits awaiting you.
- Qlik Community
- :
- All Forums
- :
- QlikView App Dev
- :
- Pivot table Buckets issue?
- Subscribe to RSS Feed
- Mark Topic as New
- Mark Topic as Read
- Float this Topic for Current User
- Bookmark
- Subscribe
- Mute
- Printer Friendly Page
- Mark as New
- Bookmark
- Subscribe
- Mute
- Subscribe to RSS Feed
- Permalink
- Report Inappropriate Content
Pivot table Buckets issue?
HI All,
I have created Buckets(0-3 Months,3-6 Months,6-9 Months,9-12 Months,1-2 Years,2-3 Years,3-4 Years) in Dimesion..
My Buckets are Working Fine..Here My concern is I have added Some more Expressions, but that Expressions are also coming under Buckets, I dont Want these ? it showl show Separate column..
How can I acheive this...?
Regards,
Helen
- Mark as New
- Bookmark
- Subscribe
- Mute
- Subscribe to RSS Feed
- Permalink
- Report Inappropriate Content
Expand the pivot table to see the additional rows under your buckets, then click on the column and drag the rows to the column area of your chart. You should see a large blue arrow when you drag the rows.
- Mark as New
- Bookmark
- Subscribe
- Mute
- Subscribe to RSS Feed
- Permalink
- Report Inappropriate Content
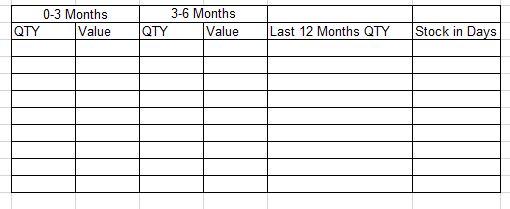
HI colin,
I have dragged the Expression column Under buckets, Then Entire Expressions are Moving into Column...
O/P for Example like this:
regards,
Helen
- Mark as New
- Bookmark
- Subscribe
- Mute
- Subscribe to RSS Feed
- Permalink
- Report Inappropriate Content
Can you post a screen shot of what you are trying to achieve?
- Mark as New
- Bookmark
- Subscribe
- Mute
- Subscribe to RSS Feed
- Permalink
- Report Inappropriate Content
I have added Some buckets, Like this...

- Mark as New
- Bookmark
- Subscribe
- Mute
- Subscribe to RSS Feed
- Permalink
- Report Inappropriate Content
Hi Helen,
You cannot achieve this in a single pivot table. 
As you have found, all columns will be part of the pivot, so you will have The buckets above the Last 12 Months & Stock in Days columns. You will either need to create two charts, one for the buckets, the other of the Last 12 Months & Stock in Days data, or change your chart to a straight table.
Using a straight table you will have to create separate expressions for each column -
0-3Mths Qty, 0-3Mths Value, 3-6Mths Qty, 3-6Mths Value, Last 12 Mths, Stock in Days.
I would go for the straight table approach, you can still have an element of drill down by using a drill-down group as a dimension.
- Mark as New
- Bookmark
- Subscribe
- Mute
- Subscribe to RSS Feed
- Permalink
- Report Inappropriate Content
OK, I will create Separate chart for Other Expressions..
But I want to Supress One Expression Which is coming zero, Whether it is possible...
Regards,
Helen
- Mark as New
- Bookmark
- Subscribe
- Mute
- Subscribe to RSS Feed
- Permalink
- Report Inappropriate Content
Hi,
can you post your solution so far to look for the issue?
regards
Marco
- Mark as New
- Bookmark
- Subscribe
- Mute
- Subscribe to RSS Feed
- Permalink
- Report Inappropriate Content
Is it Possible to Sum up the Total Stock QTY & Total Stock Value ..In a Separate column SO that I can identify tis much QTY has done aging....
help required....