Unlock a world of possibilities! Login now and discover the exclusive benefits awaiting you.
Announcements
April 13–15 - Dare to Unleash a New Professional You at Qlik Connect 2026: Register Now!
- Qlik Community
- :
- All Forums
- :
- QlikView App Dev
- :
- Pivot table cannot display total value
Options
- Subscribe to RSS Feed
- Mark Topic as New
- Mark Topic as Read
- Float this Topic for Current User
- Bookmark
- Subscribe
- Mute
- Printer Friendly Page
Turn on suggestions
Auto-suggest helps you quickly narrow down your search results by suggesting possible matches as you type.
Showing results for
Not applicable
2015-09-09
05:05 AM
- Mark as New
- Bookmark
- Subscribe
- Mute
- Subscribe to RSS Feed
- Permalink
- Report Inappropriate Content
Pivot table cannot display total value
Hi community,
My pivot table cannot display total value in Qlik Sense.
The data structure is shown below.
| Type1 | Type2 | Value1 | Value2 |
|---|---|---|---|
| A | X | 1 | 8 |
| B | Y | 5 | 6 |
| C | Y | 5 | 6 |
| D | Z | 7 | 9 |
From below pivot table, the total of aggr(max(Value1),Type1, Type2) should be 13. However, it cannot display value.
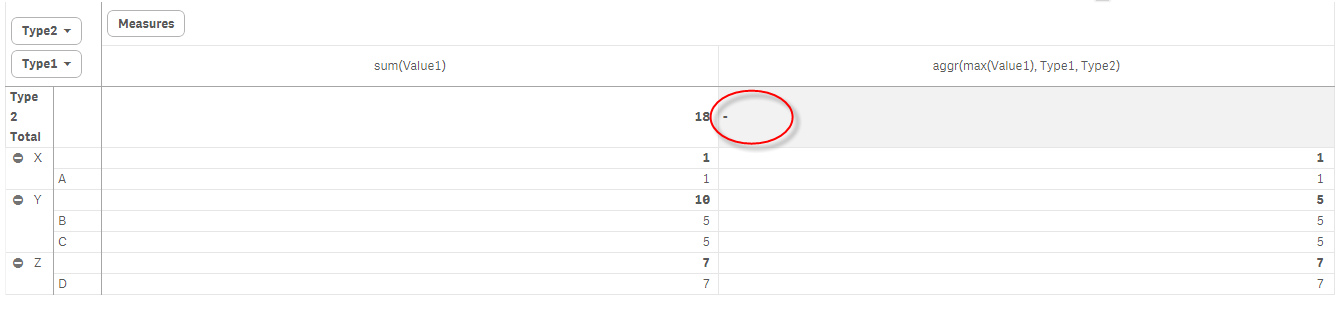
Does anyone help me on this? Thanks.
1,189 Views
1 Solution
Accepted Solutions
MVP
2015-09-09
05:29 AM
- Mark as New
- Bookmark
- Subscribe
- Mute
- Subscribe to RSS Feed
- Permalink
- Report Inappropriate Content
990 Views
5 Replies
MVP
2015-09-09
05:12 AM
- Mark as New
- Bookmark
- Subscribe
- Mute
- Subscribe to RSS Feed
- Permalink
- Report Inappropriate Content
Try this expression:
=Sum(Aggr(Max(Value1),Type1, Type2))
990 Views
Not applicable
2015-09-09
05:21 AM
Author
- Mark as New
- Bookmark
- Subscribe
- Mute
- Subscribe to RSS Feed
- Permalink
- Report Inappropriate Content
Hi Sunny
If I use Sum(Aggr(Max(Value1),Type1, Type2)), the total value of Y is 10 instead of 5.
990 Views
MVP
2015-09-09
05:29 AM
- Mark as New
- Bookmark
- Subscribe
- Mute
- Subscribe to RSS Feed
- Permalink
- Report Inappropriate Content
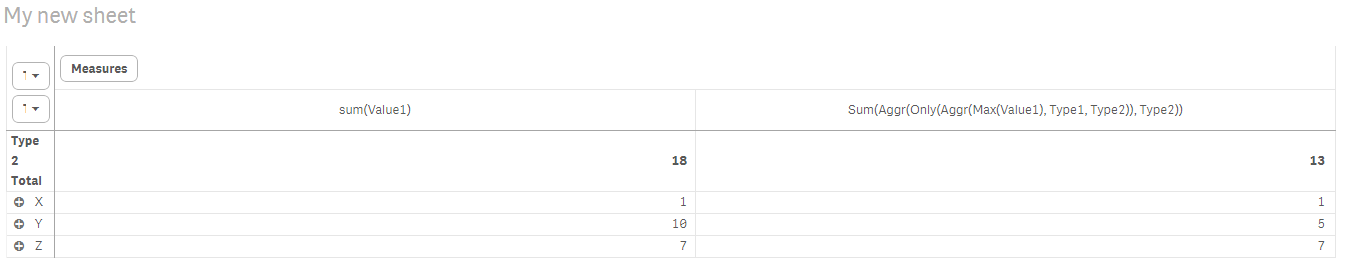
Try this:
=Sum(Aggr(Only(Aggr(Max(Value1), Type1, Type2)), Type2))
991 Views
Not applicable
2015-09-10
11:58 AM
Author
- Mark as New
- Bookmark
- Subscribe
- Mute
- Subscribe to RSS Feed
- Permalink
- Report Inappropriate Content
Sunny, Thank you very much for your help.
990 Views
MVP
2015-09-10
01:35 PM
- Mark as New
- Bookmark
- Subscribe
- Mute
- Subscribe to RSS Feed
- Permalink
- Report Inappropriate Content
Not a problem 
I am glad I was able to help.
Best,
Sunny
990 Views