Unlock a world of possibilities! Login now and discover the exclusive benefits awaiting you.
- Qlik Community
- :
- All Forums
- :
- QlikView App Dev
- :
- Pivot table with value based in another value
- Subscribe to RSS Feed
- Mark Topic as New
- Mark Topic as Read
- Float this Topic for Current User
- Bookmark
- Subscribe
- Mute
- Printer Friendly Page
- Mark as New
- Bookmark
- Subscribe
- Mute
- Subscribe to RSS Feed
- Permalink
- Report Inappropriate Content
Pivot table with value based in another value
Hello,
I have some values by week.
I want to show the week and two columns, one with the value of the week and another that shows the value of the week+2.
Ex.
Data
Week WeekValue
1 10
2 20
3 30
4 40
5 50
6 60
I want to create a pivot table that includes a column that shows the value of the week+2. The result should be:
Week WeekValue NewColumn = Week +2
1 10 30 Value of Week3
2 20 40 Value of Week4
3 30 50 Value of Week5
4 40 60 Value of Week6
5 50 ...
6 60 ...
... ... ...
Thanks in advance for your help.
- Tags:
- new_to_qlikview
- Mark as New
- Bookmark
- Subscribe
- Mute
- Subscribe to RSS Feed
- Permalink
- Report Inappropriate Content
If the expression for WeekValue is sum(WeekValue) then the expression for NewColumn is below(sum(WeekValue),2,1)
talk is cheap, supply exceeds demand
- Mark as New
- Bookmark
- Subscribe
- Mute
- Subscribe to RSS Feed
- Permalink
- Report Inappropriate Content
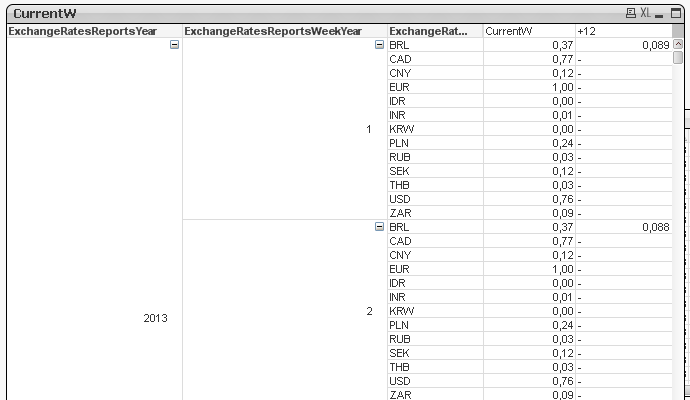
Hello, The problem is that I have another dimension, I can't get the value by position.
Check my table below.
I have exchange rates by Year, Week and Currency. I'm showing the avg of the Exchange Rate by week and in the last column I want to show the avg for the week +12.