Unlock a world of possibilities! Login now and discover the exclusive benefits awaiting you.
- Qlik Community
- :
- All Forums
- :
- QlikView App Dev
- :
- Problem with line chart dimension
- Subscribe to RSS Feed
- Mark Topic as New
- Mark Topic as Read
- Float this Topic for Current User
- Bookmark
- Subscribe
- Mute
- Printer Friendly Page
- Mark as New
- Bookmark
- Subscribe
- Mute
- Subscribe to RSS Feed
- Permalink
- Report Inappropriate Content
Problem with line chart dimension
Hi, i have a question.
I want to show a line chart with 3 dimension (YEARMONTH, DATE, and BRAND)
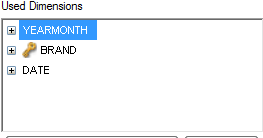
But it only shown two dimension (YEARMONTH and BRAND) like this:
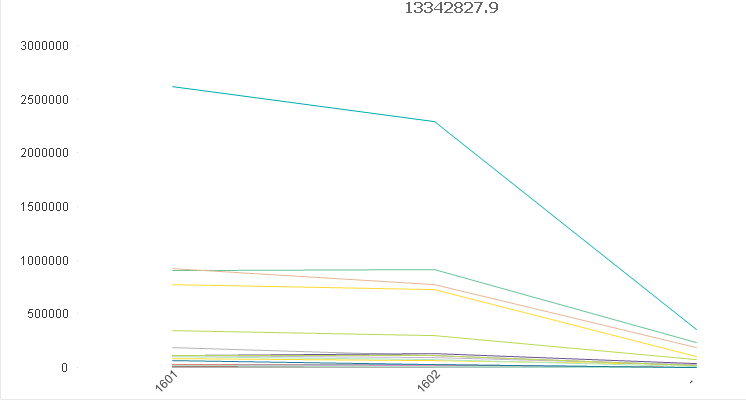
each color represent each brand.
I want to show the date dimension above yearmonth dimension.
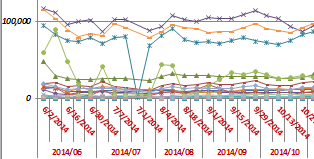
For the illustration, i want to show my line chart like this:
Really appreciate your help.
thanks
Accepted Solutions
- Mark as New
- Bookmark
- Subscribe
- Mute
- Subscribe to RSS Feed
- Permalink
- Report Inappropriate Content
Hi
Try like this
How to use 3 dimensions in Line chart
Please close the thread by marking correct answer & give likes if you like the post.
- Mark as New
- Bookmark
- Subscribe
- Mute
- Subscribe to RSS Feed
- Permalink
- Report Inappropriate Content
Hi
Try like this
How to use 3 dimensions in Line chart
Please close the thread by marking correct answer & give likes if you like the post.
- Mark as New
- Bookmark
- Subscribe
- Mute
- Subscribe to RSS Feed
- Permalink
- Report Inappropriate Content
one way to solve your problem is to Concatenate the two dimension as one , Go to dimension > add calculated dimension >
BRAND &'-'& DATE
- Mark as New
- Bookmark
- Subscribe
- Mute
- Subscribe to RSS Feed
- Permalink
- Report Inappropriate Content
Hi Guys,
thanks for your reply, it makes me clear about the problem.